
Table of Contents
Pacific EMIS User Guide
This is the primary user guide for the Pacific EMIS that can be used by any country adopting and building their own EMIS base on the Pacific EMIS.
Pacific EMIS Overview
The Pacific EMIS is a software platform developed to collect educational data and produce national education indicators and information useful to manage the education system. It is primarily a web-based system but also makes use of external tools such as excel workbooks to complement the system. The various parts of the system will be discussed in this guide.
Accessing Pacific EMIS
Location
Since it is primarily a web-based system you can access it with any recent web browser such as Google Chrome, Firefox, Safari or Edge. The URL will differ by country but generally you can point your web browser to something like:
http://data.domain.edu or http://data.domain.edu/emis or http://emis.domain.edu
It is also possible to access with a remote parameter enabling downloading of most third party libraries from international cloud providers instead of the local servers. In some cases, particular for those accessing from outside the countries this could be faster. The above examples would be.
http://data.domain.edu?remote#!/ or http://data.domain.edu/emis?remote#!/ or http://emis.domain.edu?remote#!/
The exact URL will be given to you by some people in country to support the system.
Login
Upon browsing to the correct location you will be presented with the following. The user name could be either your email or an Active Directory user that you use to login Windows on your network. The Stay logged in? checkbox enables you to remain logged in even if you open new tabs in your browser.

Resetting Forgotten Password
If you forget your password and you have a email user you can click on Forgot password at the login page.

You will get the following where you enter your exact email as known by the EMIS and it will send you an email for you to reset your password.

You will receive an email like the following. Check your spam folder if you do not receive it within a few minutes. Follow the link to reset your password.

Follow the rules to create a secure password. Your password will be reset is strong enough and then you can login again.

Overview of Features (Modules)
Once you successfully login you will see something like follows. On the right hand side are the activated features also called modules of the EMIS but more can be added.

Many modules have common features and thereforewill be reviewed generally and not repeated for each module throughout the user guide
Dashboards - analysing your data
Dashboard is a common sub-menu item to most module in the system. It provides a live analysis of all your data in the system. It supports across the whole dashboard filtering, dynamic interaction and even drill down in some instances. The red arrows shows how to get to a dashboard, where to click for the filters and examples of how how you can interact directly with the dashboard by clicking various places in the charts and tables.

List - accessing your data
Another common one is the sub-menu item “list” where the user can access the whole data set for this module. Here is an example of this showing the list of schools.

From the list of entities (e.g. Schools, Teachers, etc.) you can click on the ID to view the individual entity (e.g. a particular school, a particular teacher, etc.). The schools also has a link you can click to update the location of the school on a map.

Chart - simple chart analysis
The sub-menu item “chart” displays some count analysis of the entity dataset.

Table - simple table analysis
The sub-menu item “table” is similar to chart but in the form of a table displays some count analysis of the entity dataset.

Map - simple geographical analysis
The sub-menu item “map” includes a small Geographic Information System (GIS) component where various things can be expressed on a map.

Reports - standard reports from your data
The sub-menu item “reports” is where you can get a list of reports with all sorts of valuable information about the entities. More reports can be designed and added based on your information needs. Reports can be exported as PDF, Word Documents and Excel documents but more formats are also supported if desired.

Searching/Filtering Data
From with the sub-menu item “list” another commonly found feature is the ability to search or filter data and also switch what sort of columns of your data is showing.
Change Column Set Displayed of Data
When you click on the magnifying glass as shown below you will see a form. The part at the top “Change Columns Set” can be used to alter the columns displayed in the list of entities.

For example, you may want to display a summary list of columns showing enrolment data for the latest data collection which is what is being done below by selecting “Latest Survey”.

Searching/Filtering Data of Interest
The part just below “Search/Filter Dataset” can be used to filter the data shown in the list (e.g. only show primary schools, show a single school by filtering with an ID). You can search your data in a great number of ways.
The following two examples first search for a particular school using its School ID and then filters only School managed by the Protestant Church even closed schools.


We will discuss the modules one by one in following sections.
Indicators
Indicators currently shows, for each education level configured (e.g. Early Childhood Education, Primary and Secondary), a grid with a list of key education indicators for a particular education level (e.g. Primary). Much more indicators are supported by the system then shown and can be activated with small system upgrades.
Some countries may even want to have those data disaggregated by districts (i.e. called states, provinces, or atolls and islands depending on the country). Currently the indicators by district would be as sub-sub-menu items also shown below for the states of Federated States of Micronesia as example.
You can change the years to get those values for years when data is available. You can also observed change between two years in the third columns to the right.

You can also view an historical perspective by clicking on the historical tab. This will show you trends over time for all the data you have.

Budgets
Managing financial data is important for a number of key education indicators such as:
- Public Expenditure on Education as % of Total Government Expenditure
- Percentage Distribution of Public Current Expenditure on Education by Level
- Public Current Expenditure per Pupil (Student) as % of Gross National Income (GNI) per Capita
- Public Current Expenditure per Teacher as % of Gross National Income (GNI) per Capita
- Percentage of Public Current Expenditure on Education for Teachers
- Public Current Expenditure on Education as % of Total Public Expenditure on Education
- Personnel Compensation as % of Public Current Expenditure on Education
- Public Expenditure on a Specific ISCED Level as % of Total Public Expenditure on Education
Creating Cost Centres
The first thing needed to benefit from the Budgets module is to create the Cost Centres. Think of the Cost Centres as a means to categories the expenditures (e.g. Ministry of Education Admin Staff, Teacher Training, etc.) The easiest way to get this is by getting the Ministry or Department's Budget Expenditure Report. The accounting department can also provide some accurate budget data for this. The following figure is an example of such report where we can get almost all information we need.
The information under DESCR can be used for the list of cost centres. The BUDGET ADJUSTED and ACTUAL will be useful when creating the education expenditures later in following subsection below.

Taken from the figure above we would create a cost centre for each of the unique items. You create cost centres in the System Admin → Lookups → Cost Centres as shown below (there might be a Cost Centres short cut under the Budgets menu item). You can add as many cost centres as you need.

Let's add the first one “COLLEGE OF MARSHALL ISLANDS”.

And now let's add a second one “NATIONAL TRAINING COUNCIL”.

This can be added and edited much like you would an online spreadsheet. The important things to note are each of the columns and the data they hold:
- Code: a short code for the new cost centre. Simply use a short unique code for the cost centre (e.g. College of Marshall Islands could be CMI)
- Description: the full name of the cost centre
- Sector: If this cost centre will hold budget for a particular sector of education (e.g. Primary, Secondary, etc.) then select it here, otherwise leave empty
- Pro Rate: defines how the money will be allocated when computing key financial education indicators for expenditures categorized under this cost centre:
- Post to sector: for cost centres with an assigned education sector the money would only be computed towards that education sector. For example, a cost centre of “Primary Teacher Salaries” would have a sector of “Primary” and Pro Rate of “Post to sector” since that money is directly for the primary sector.
- Prorate: money in this cost centre is distributed evenly for all education sectors (e.g. MoE Administration cost center expenditures)
- Ignore: money in this cost centre would be ignore entirely and not included in the financial indicators
- Description L1: optional longer description of the cost centre.
- Description L2: a second optional longer description of the cost centre.
- Edited by…: the user who last edited the record
- Edited on…: the time the user last edited the record
Once you have entered all your cost centres it might look something like the following.

Adding the year's Government Financial Expenditure
After all the cost centres have been created you can start adding the yearly budgets. Budgets differ from year-to-year and must be created each year. It is relatively straight forward if you are given the right documents by your government finance department. Typically, the government's audited financial report will contain this data. This is done in Budgets → List. You can add a new one as shown below (or edit an existing one).

When the new budget is create you can enter the year for which you are creating the budget and the remaining of the data. Note that the system supports adding budgets at the district level (e.g. Atolls and Islands, State, Province) if your country has detailed budgets by district. Below we add the 2014 budget for the whole nation. While the GNP figures are optional you need them to produce some of the important financial education indicators.

Editing all your data like shown below and then save.

When you close your panel you will now see your new budget as shown below.

Adding the year's Education Expenditure
Finally, once cost centres and government budgets have been setup you can create the detailed education expenditures. This is detailed data about how the department of education spends money on the education system. You enter that data in the same place you entered the government financial budget. Go to Budgets → List. Choose a budget to edit and click on its ID. Above we created the 2014 budget so let's continue with that example as shown below.

Once you are inside the 2014 budget you can click on the tabl EDUCATION EXPENDITURE and then on the + to add a new education expenditure.

To know what data to include the “Budget Actual Expenditure Report” from above is brought back. The education expenditure we are adding is outline in red below with the 2 figures of interest outlined in orange.

The data is entered as shown below. The source of fund is known from the report by looking under the FUND column which is 100100 for this line and it is known that the 100100 is code the the “General Fund”. But in your report the source of fund might be identified differently. You need to understand your reports and the sources of funds.

After saving you should see them adding as shown below.

Now that we have a complete example let's explained the fields in more details:
- Cost Centre is the category of spending for this budget expenditure. This will decide how the budget will be computed (refer to Creating Cost Centres for details)
- Expenditure item an optional textual field that can provide a bit more details. You don't need this really.
- Total Expenditure is the total expenditure is the total of capital assets expenditure plus any recurring costs (cost recurring from year to year)
- Current Expenditure is expenditure on goods and services consumed within the current year, which needs to be made recurrently to sustain the production of educational services. Think of current expenditure as “recurring expenditure” (e.g. salary expenditures)
- Budget vs Actual The budgeted figure was defined during planning while the actual is the money that was actually spent. Those are typically side by side in the accounting report as shown above.
- Funding Source The source of money, whether it is direct government earning, donor, grants, etc.
Often, the figure of Current Expenditure will be the same as Total Expenditure. The only time you would not have it the same is if you are certain only a portion of this budget account remains year after year. For example, let's say that a government normally has an education expenditure called “Aid to private school” coming back every year of roughly the amount of $100,000. And that in 2020 it jumps to $500,000 because of a special one time grant from ADB of $400,000 to run a project improving the infrastructure of private schools. For that year, the education expenditure would be recorded as:
- Total Expenditure: $500,000
- Current Expenditure: $100,000
But for other “normal” years (i.e. before 2019 and after 2021) the education expenditure would be recorded as:
- Total Expenditure: $100,000
- Current Expenditure: $100,000
However, a situation like this may be rare as it might be that the government financial departments will opt to create a separate new account for this one time temporary loan. In the example above this could be setup as “Aid to private school special ADB Grant 2020”. In this scenario, the “Aid to private school” would be recorded as usual:
- Total Expenditure: $100,000
- Current Expenditure: $100,000
while the “Aid to private school special ADB Grant 2020” might be recorded as follows (and then completely disappear in future years):
- Total Expenditure: $400,000
- Current Expenditure: $0
Exams
The EMIS is capable is loading raw data or data from external system. The most common scenario at the time of this writing is loading all the raw exam student scores (i.e. raw data).
Upload Data
Loading the data is done by browsing to the Upload Exams page.
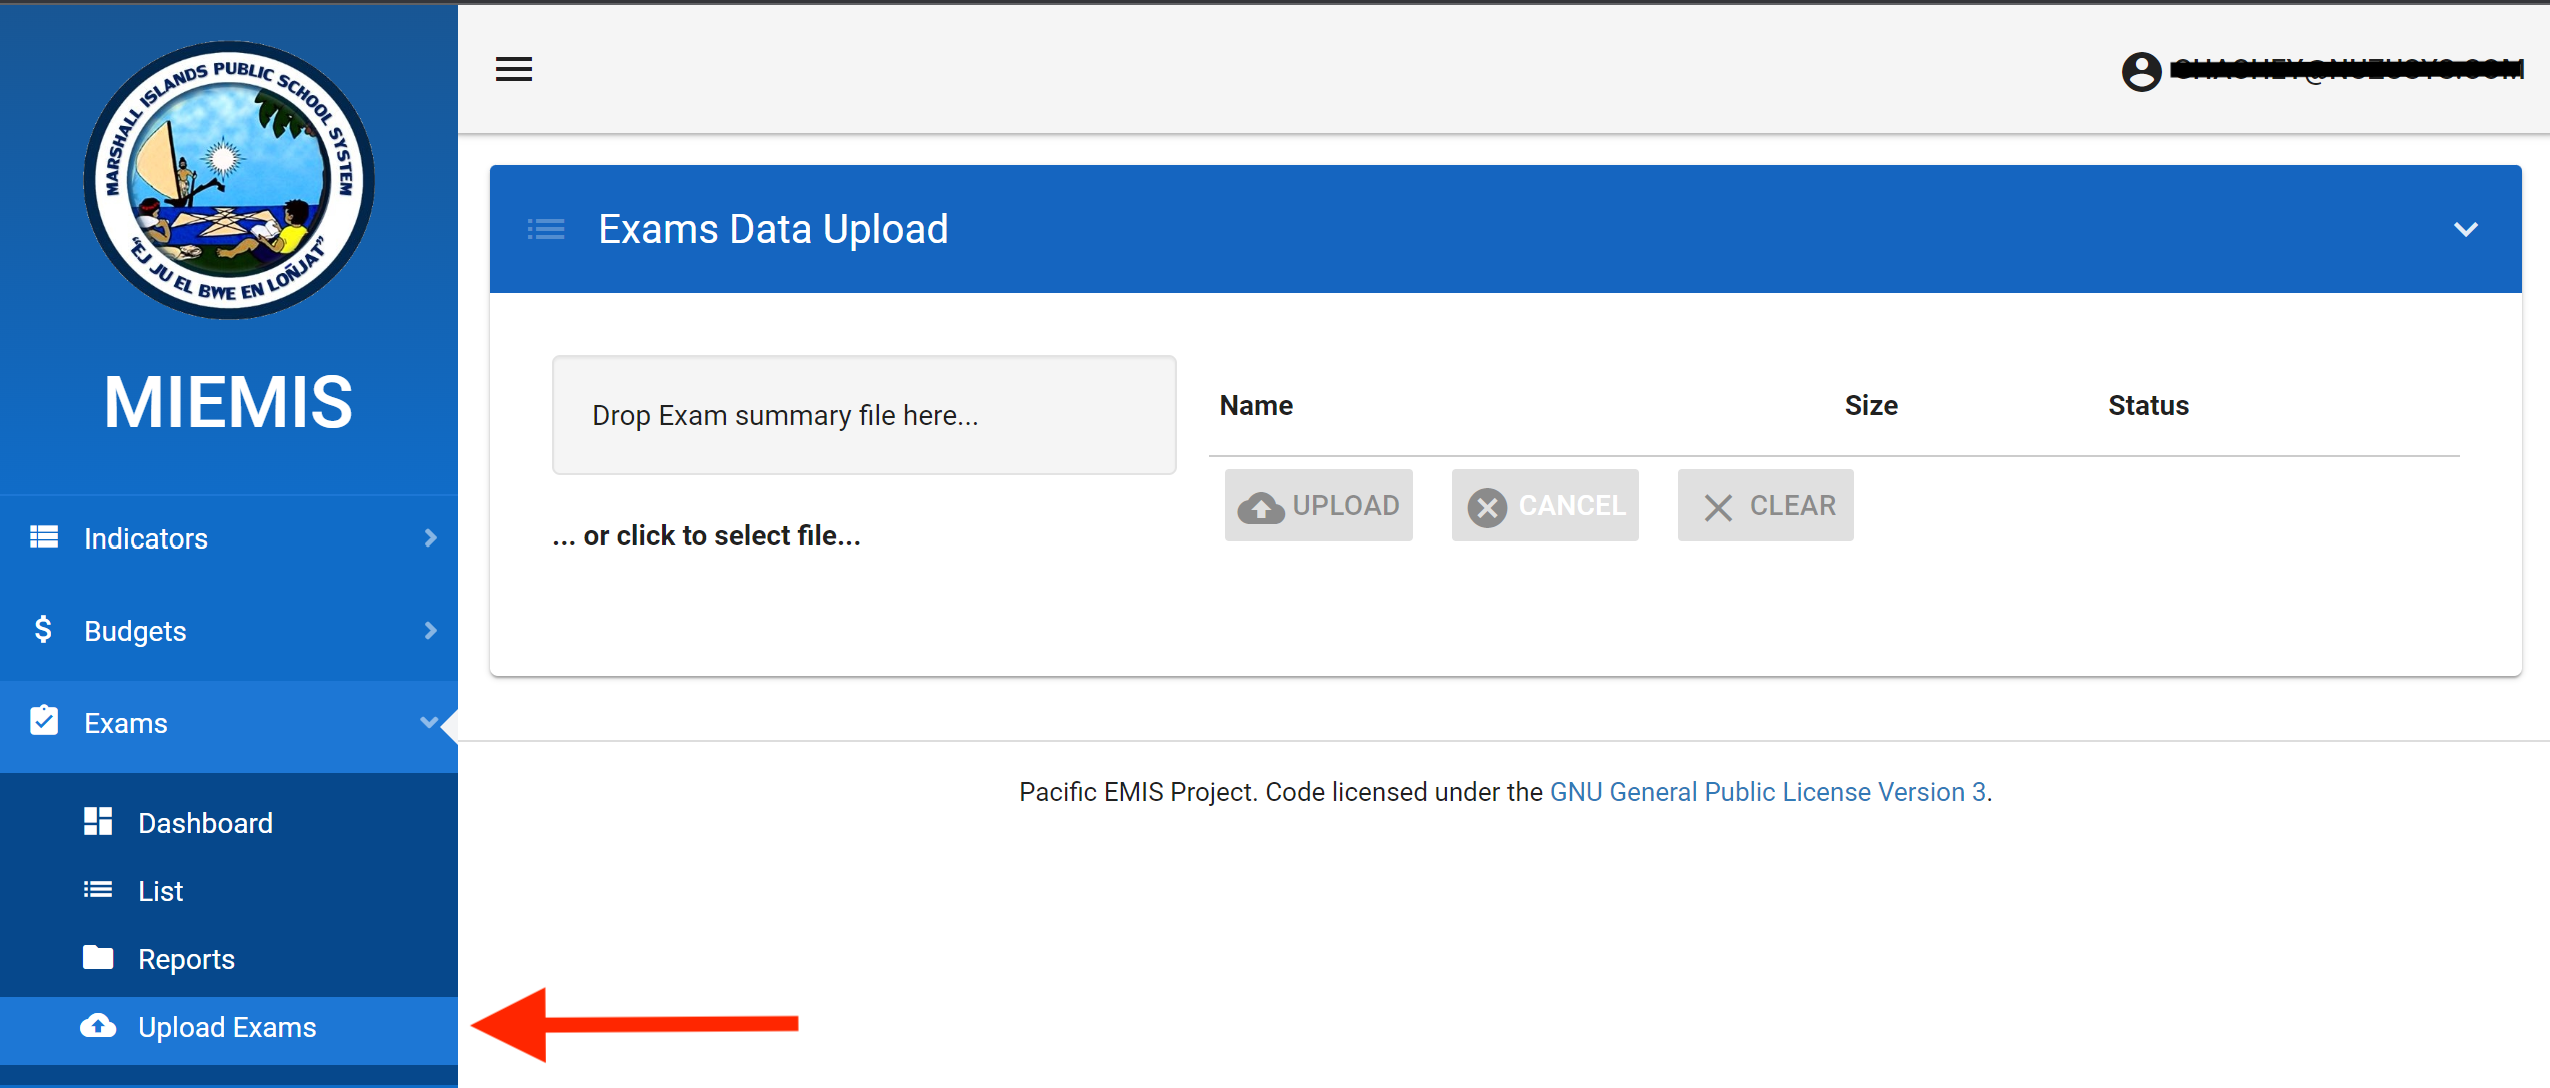
You can then drag the data file as shown below. Exams files must be loaded one by one.
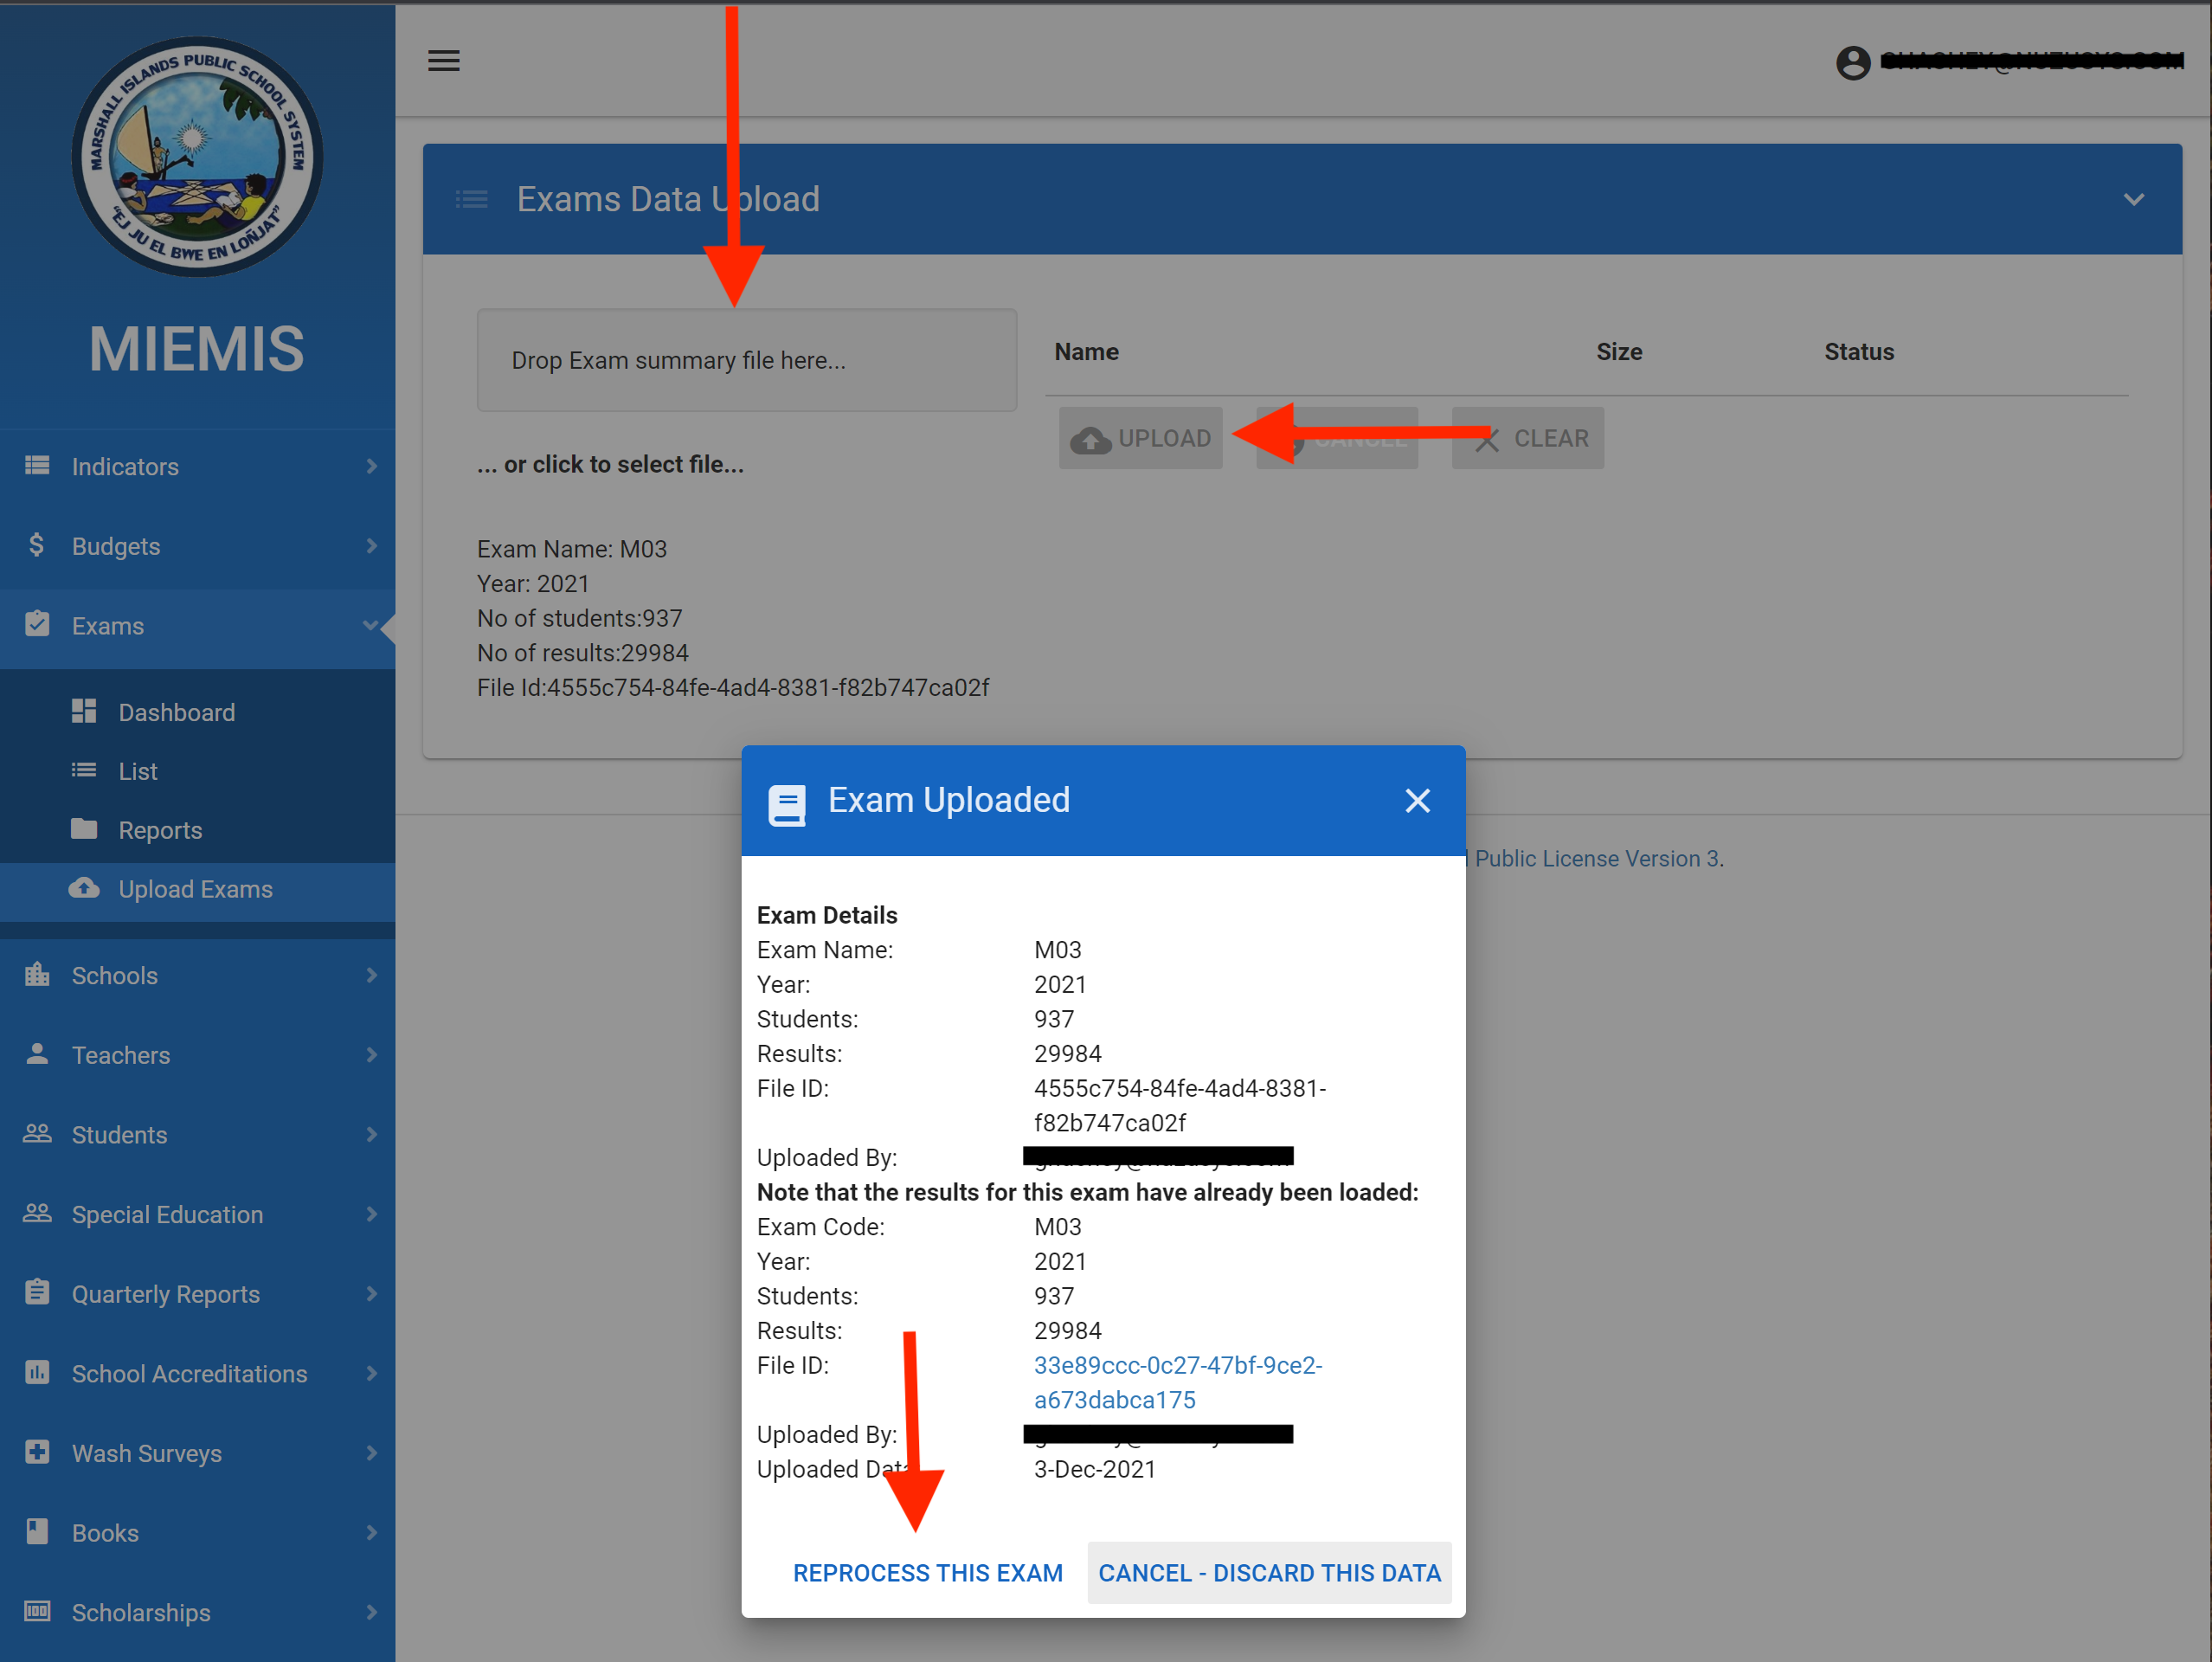
Details on the format to use for the loading of the raw data can be found at EMIS Exams Module Data Loading
List Data
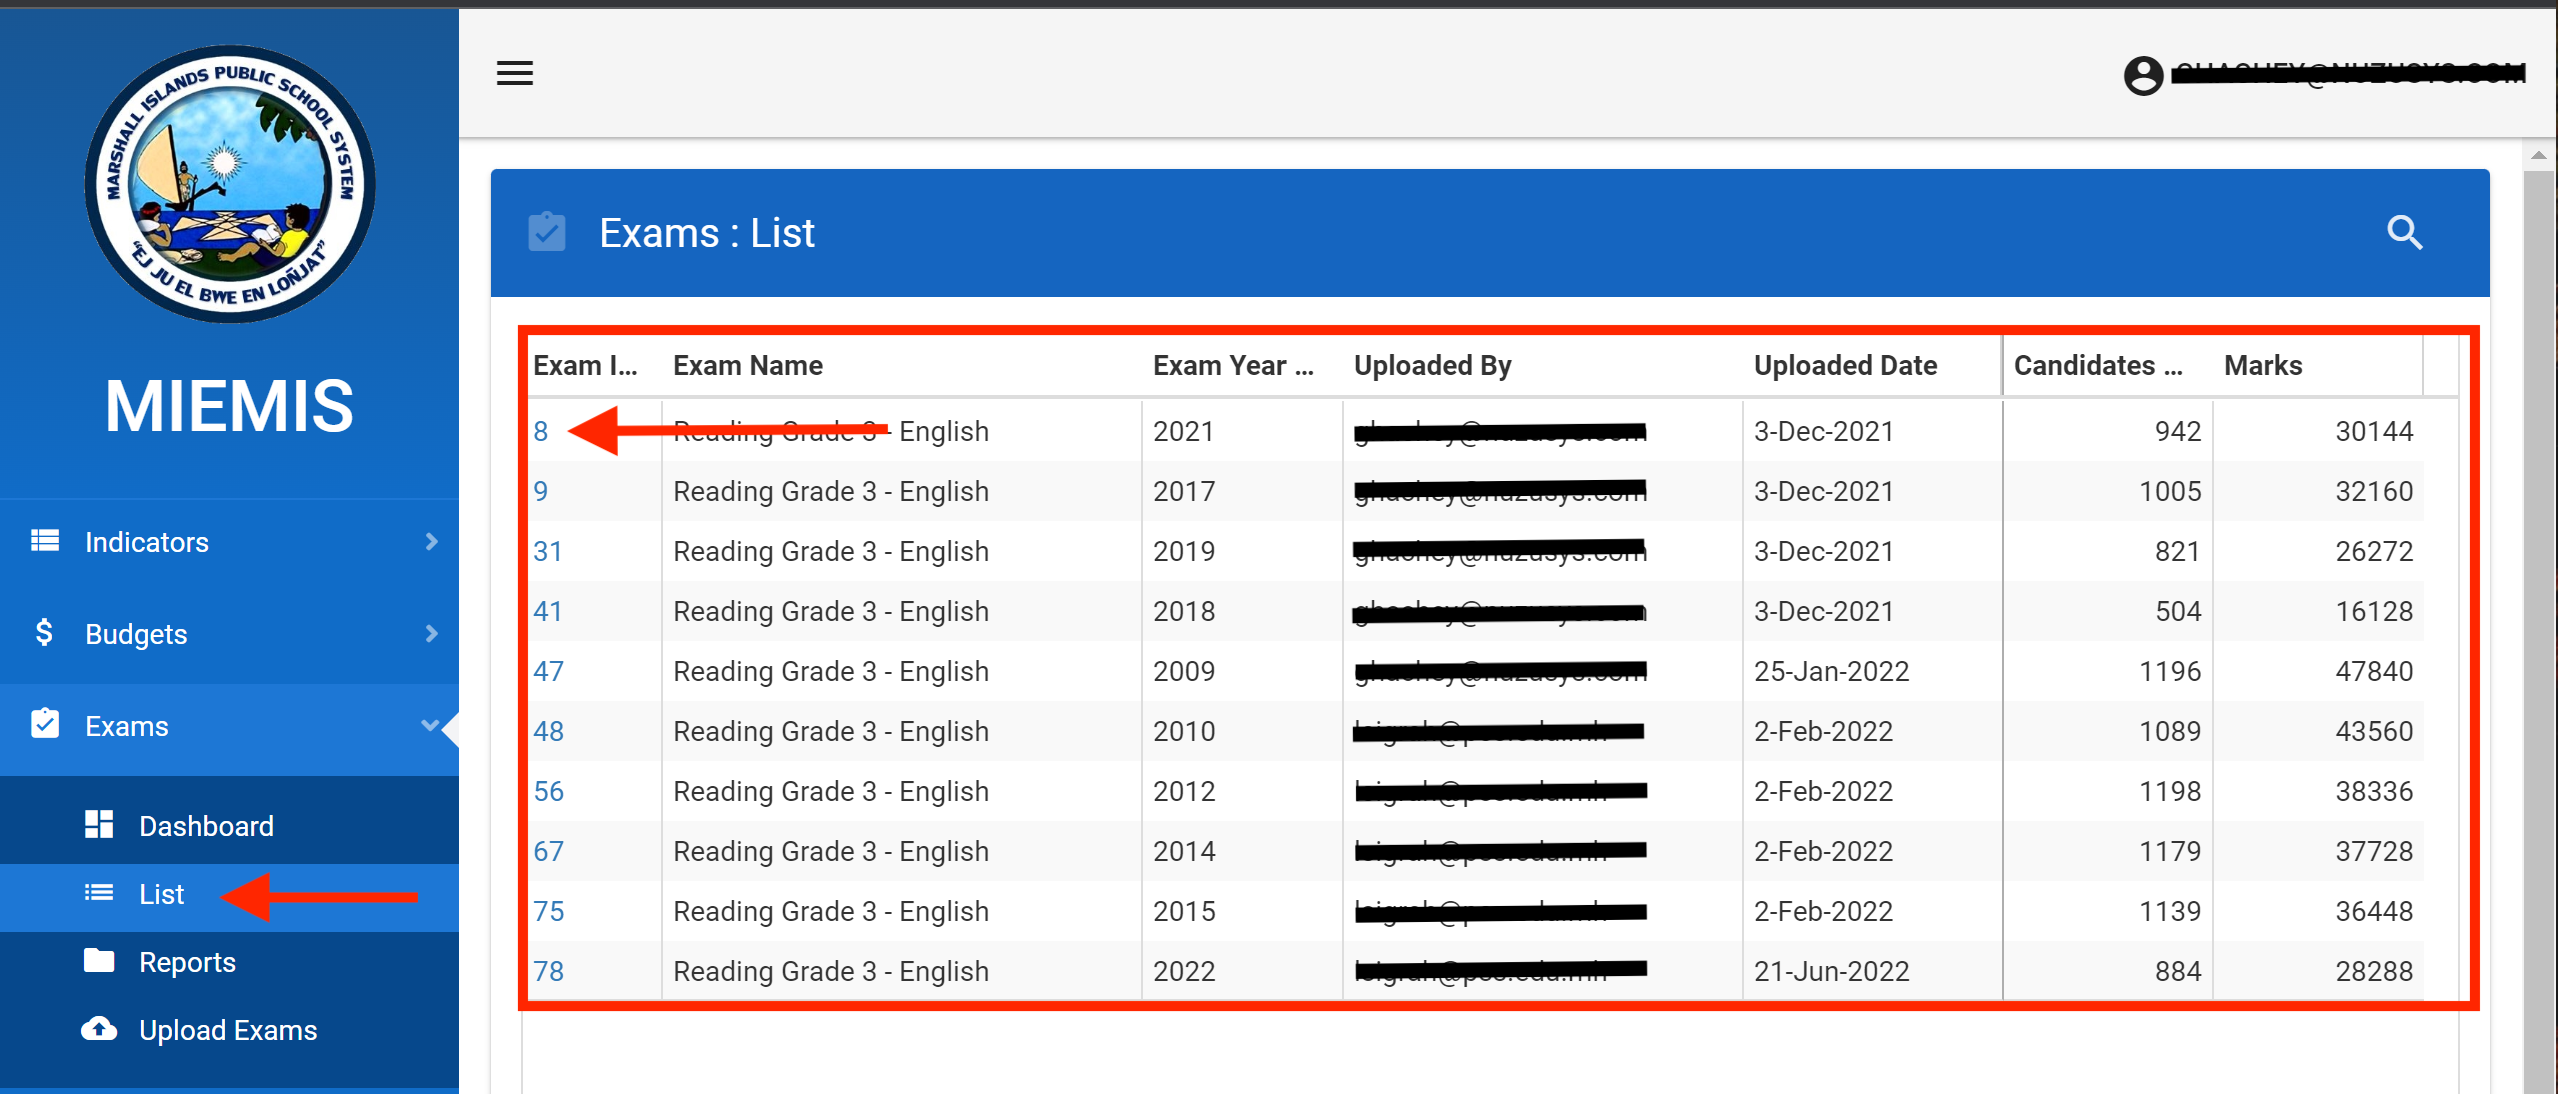
Once loaded, exams are in the database ready for processing and analysis. You can view all the loaded files by browsing to the Exams → List.
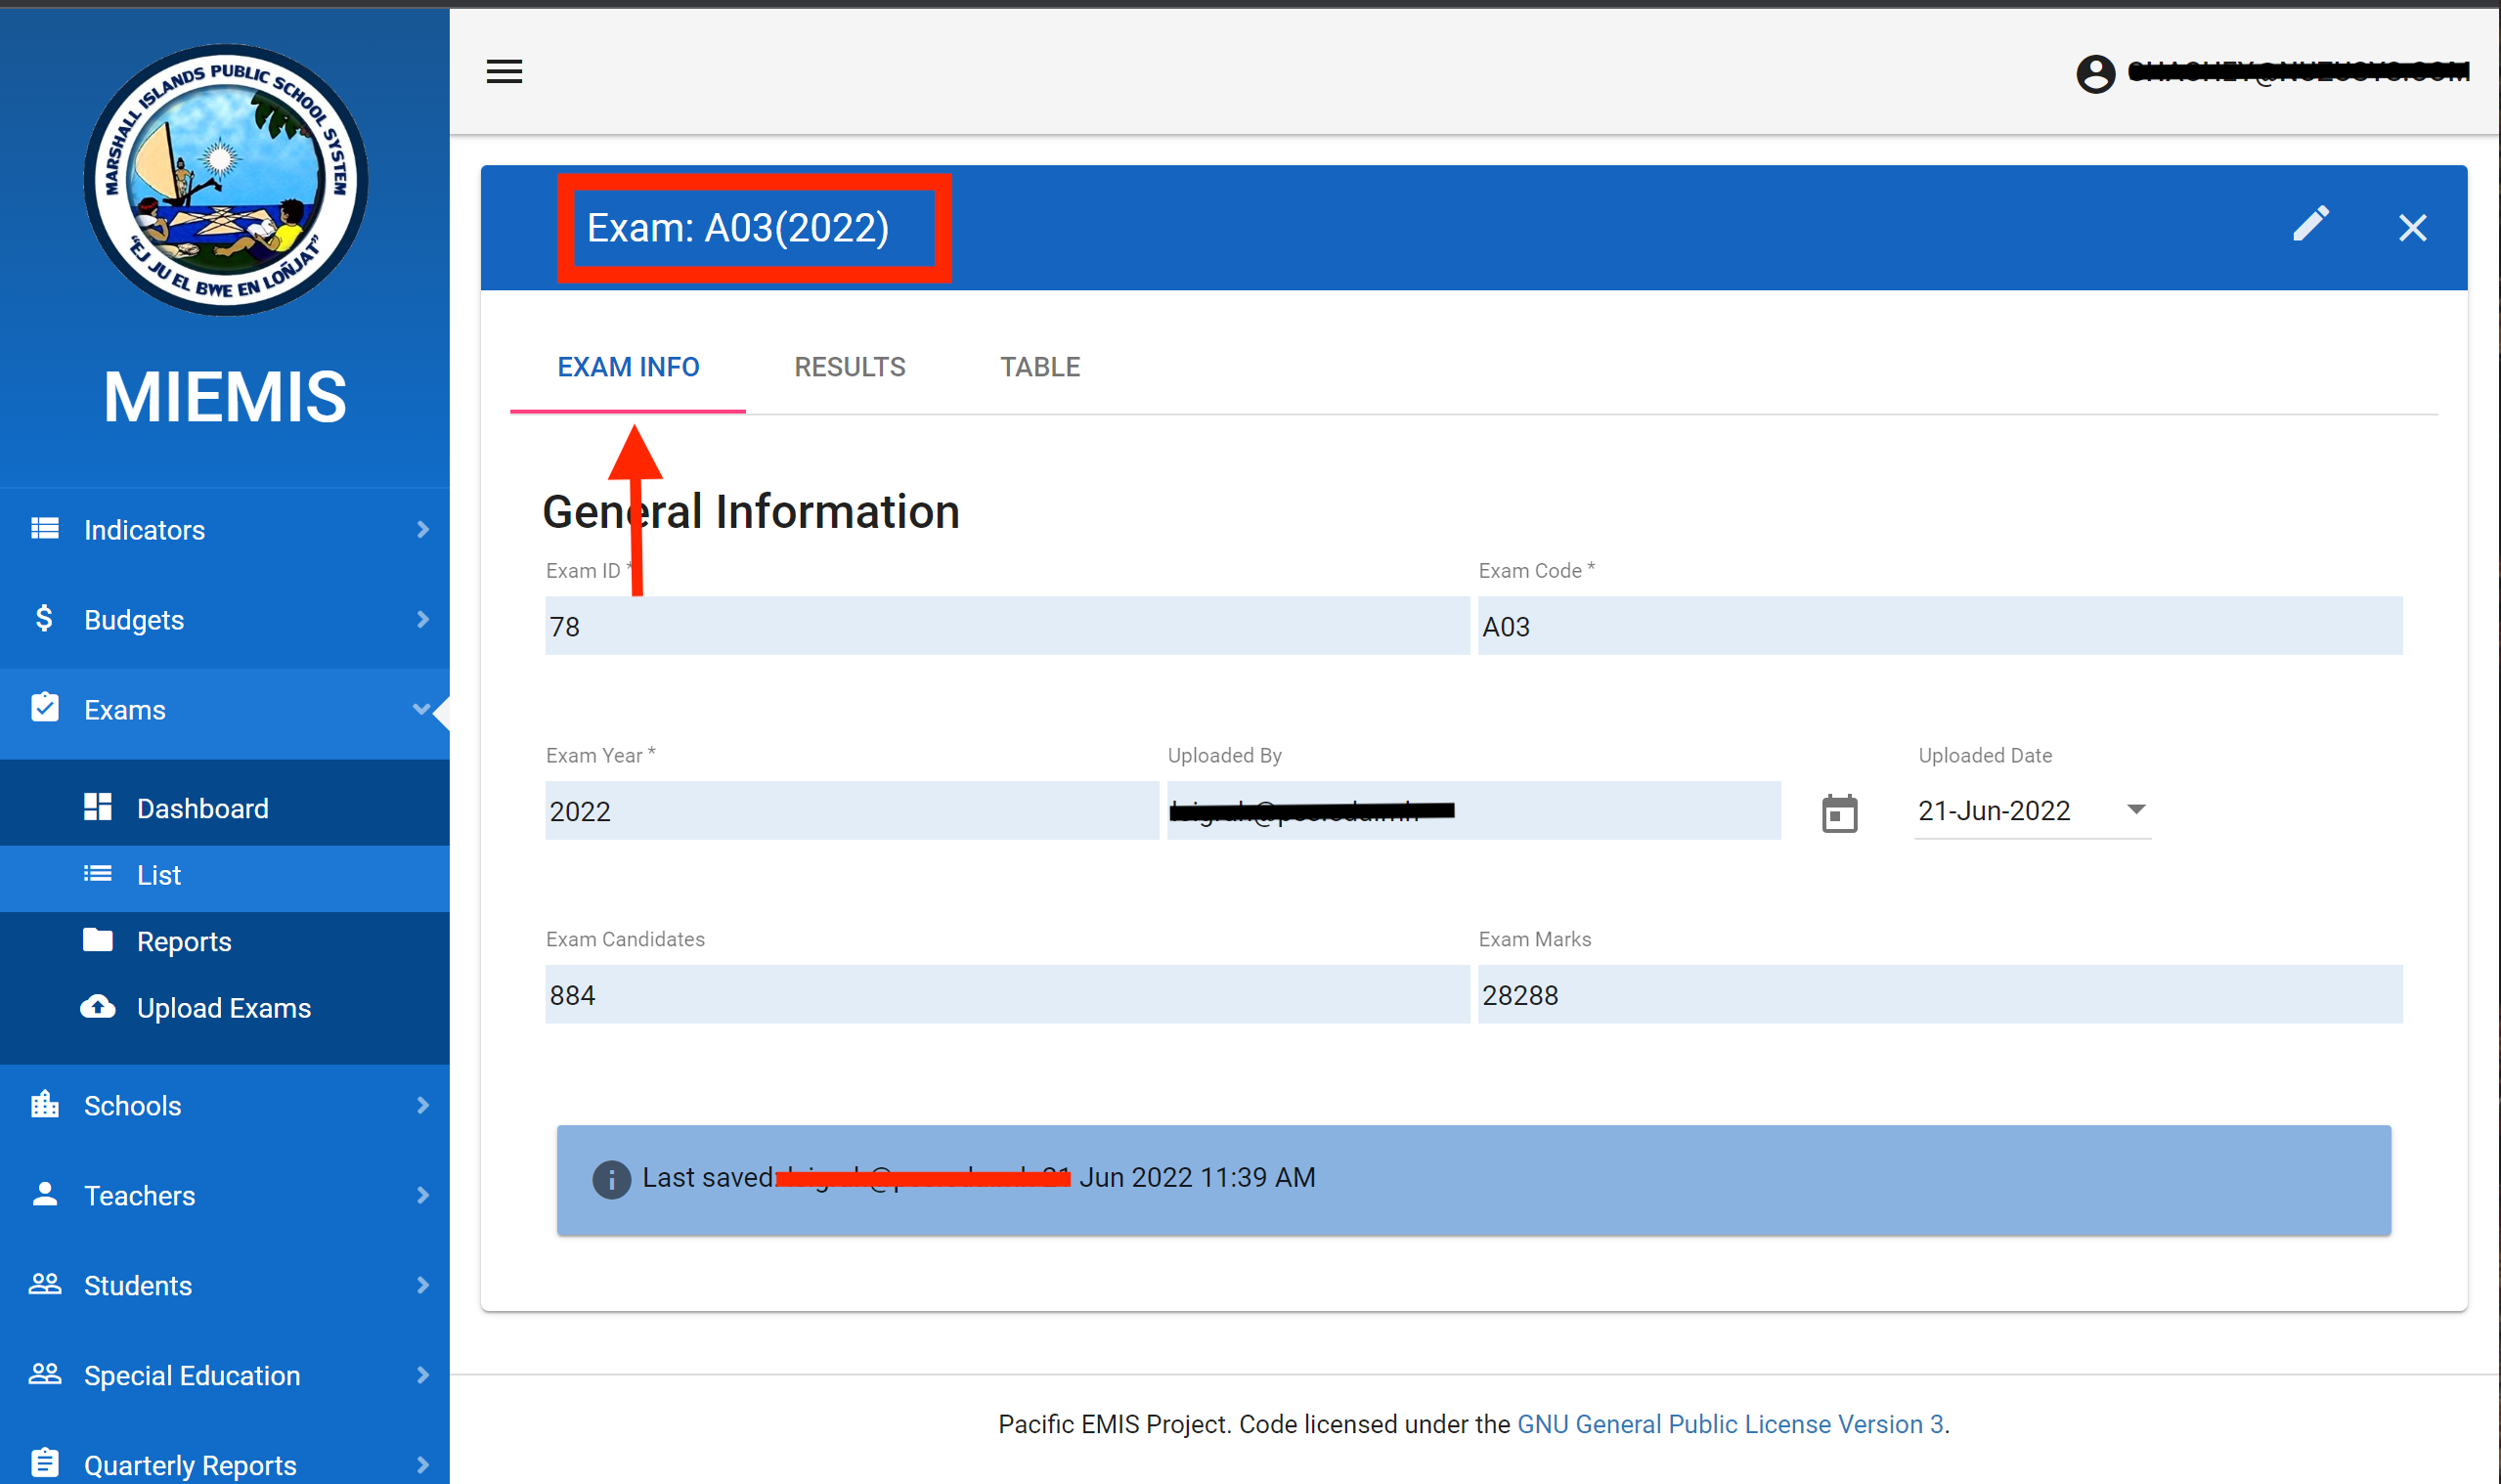
View Exam Data
You can then select any of the loaded exams to view its details. The first thing you will see is some general information about the chosen exam such as the exam ID, code, year, who uploaded the data, when the data was uploaded, total number of candidates that took the exam and total possible marks entered into the system (typically total candidate multiplied by the number of items on the exam).
Click on the Results tab and you see the analysis of the exam.
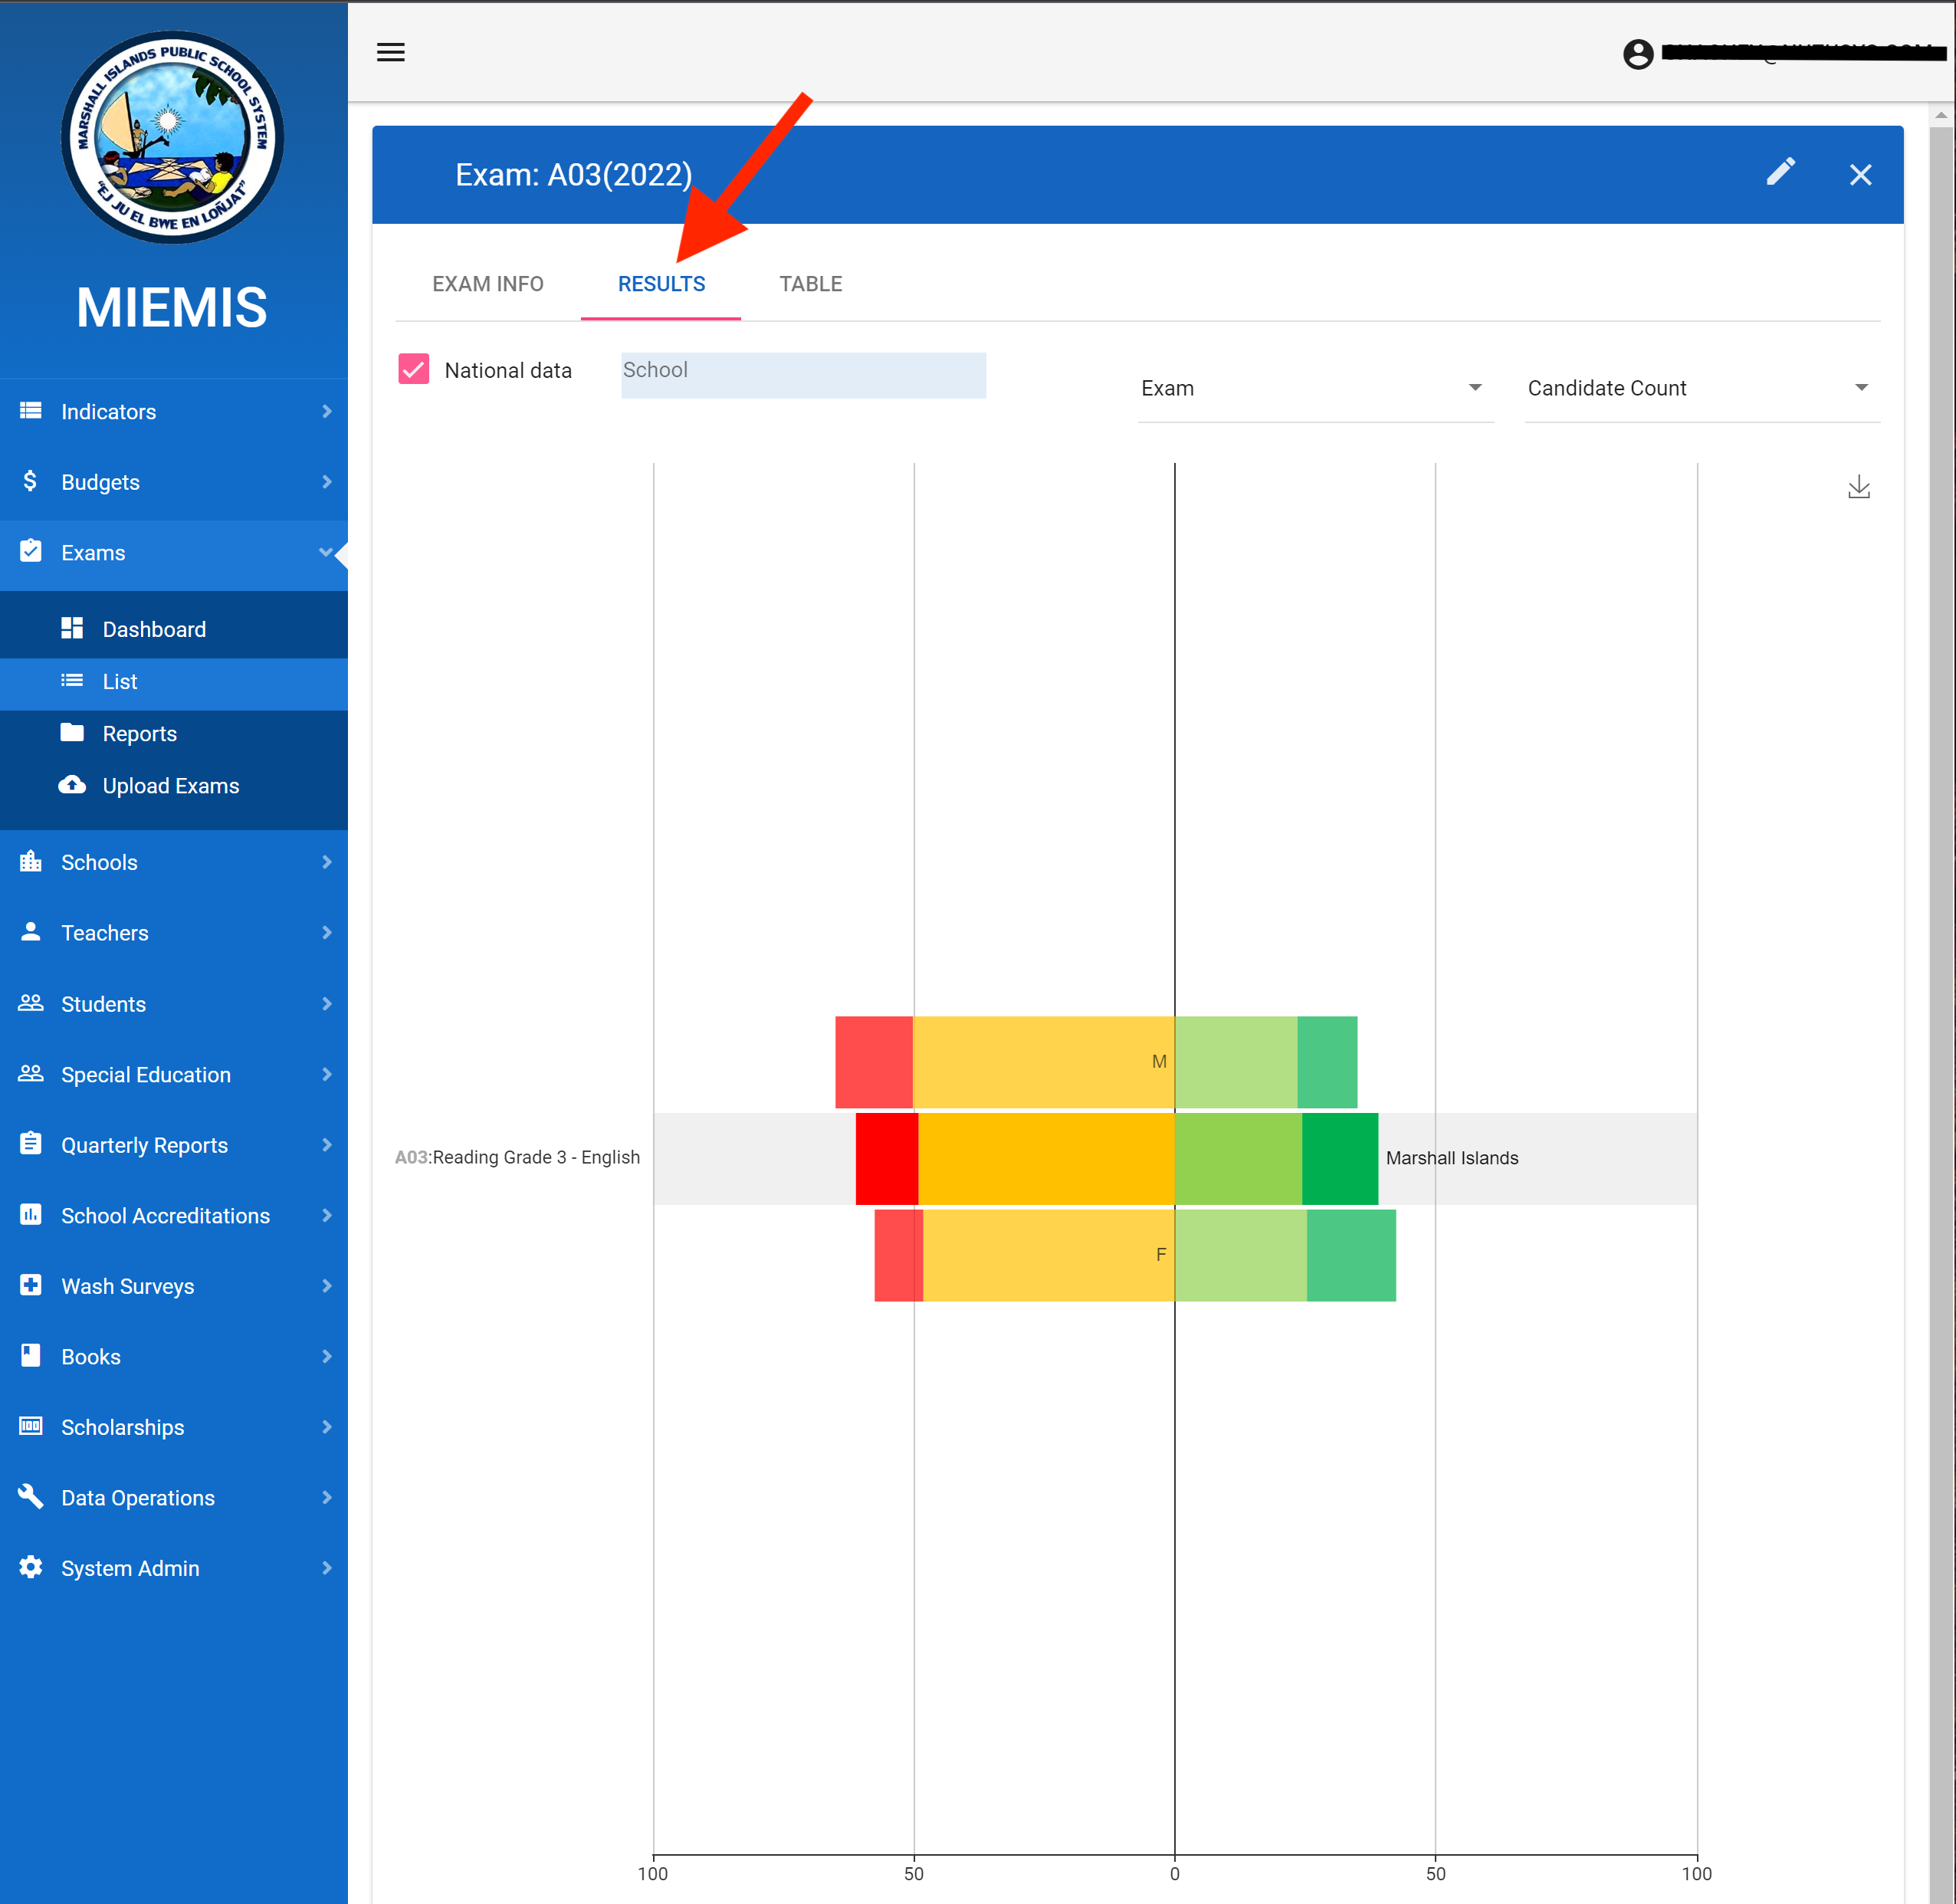
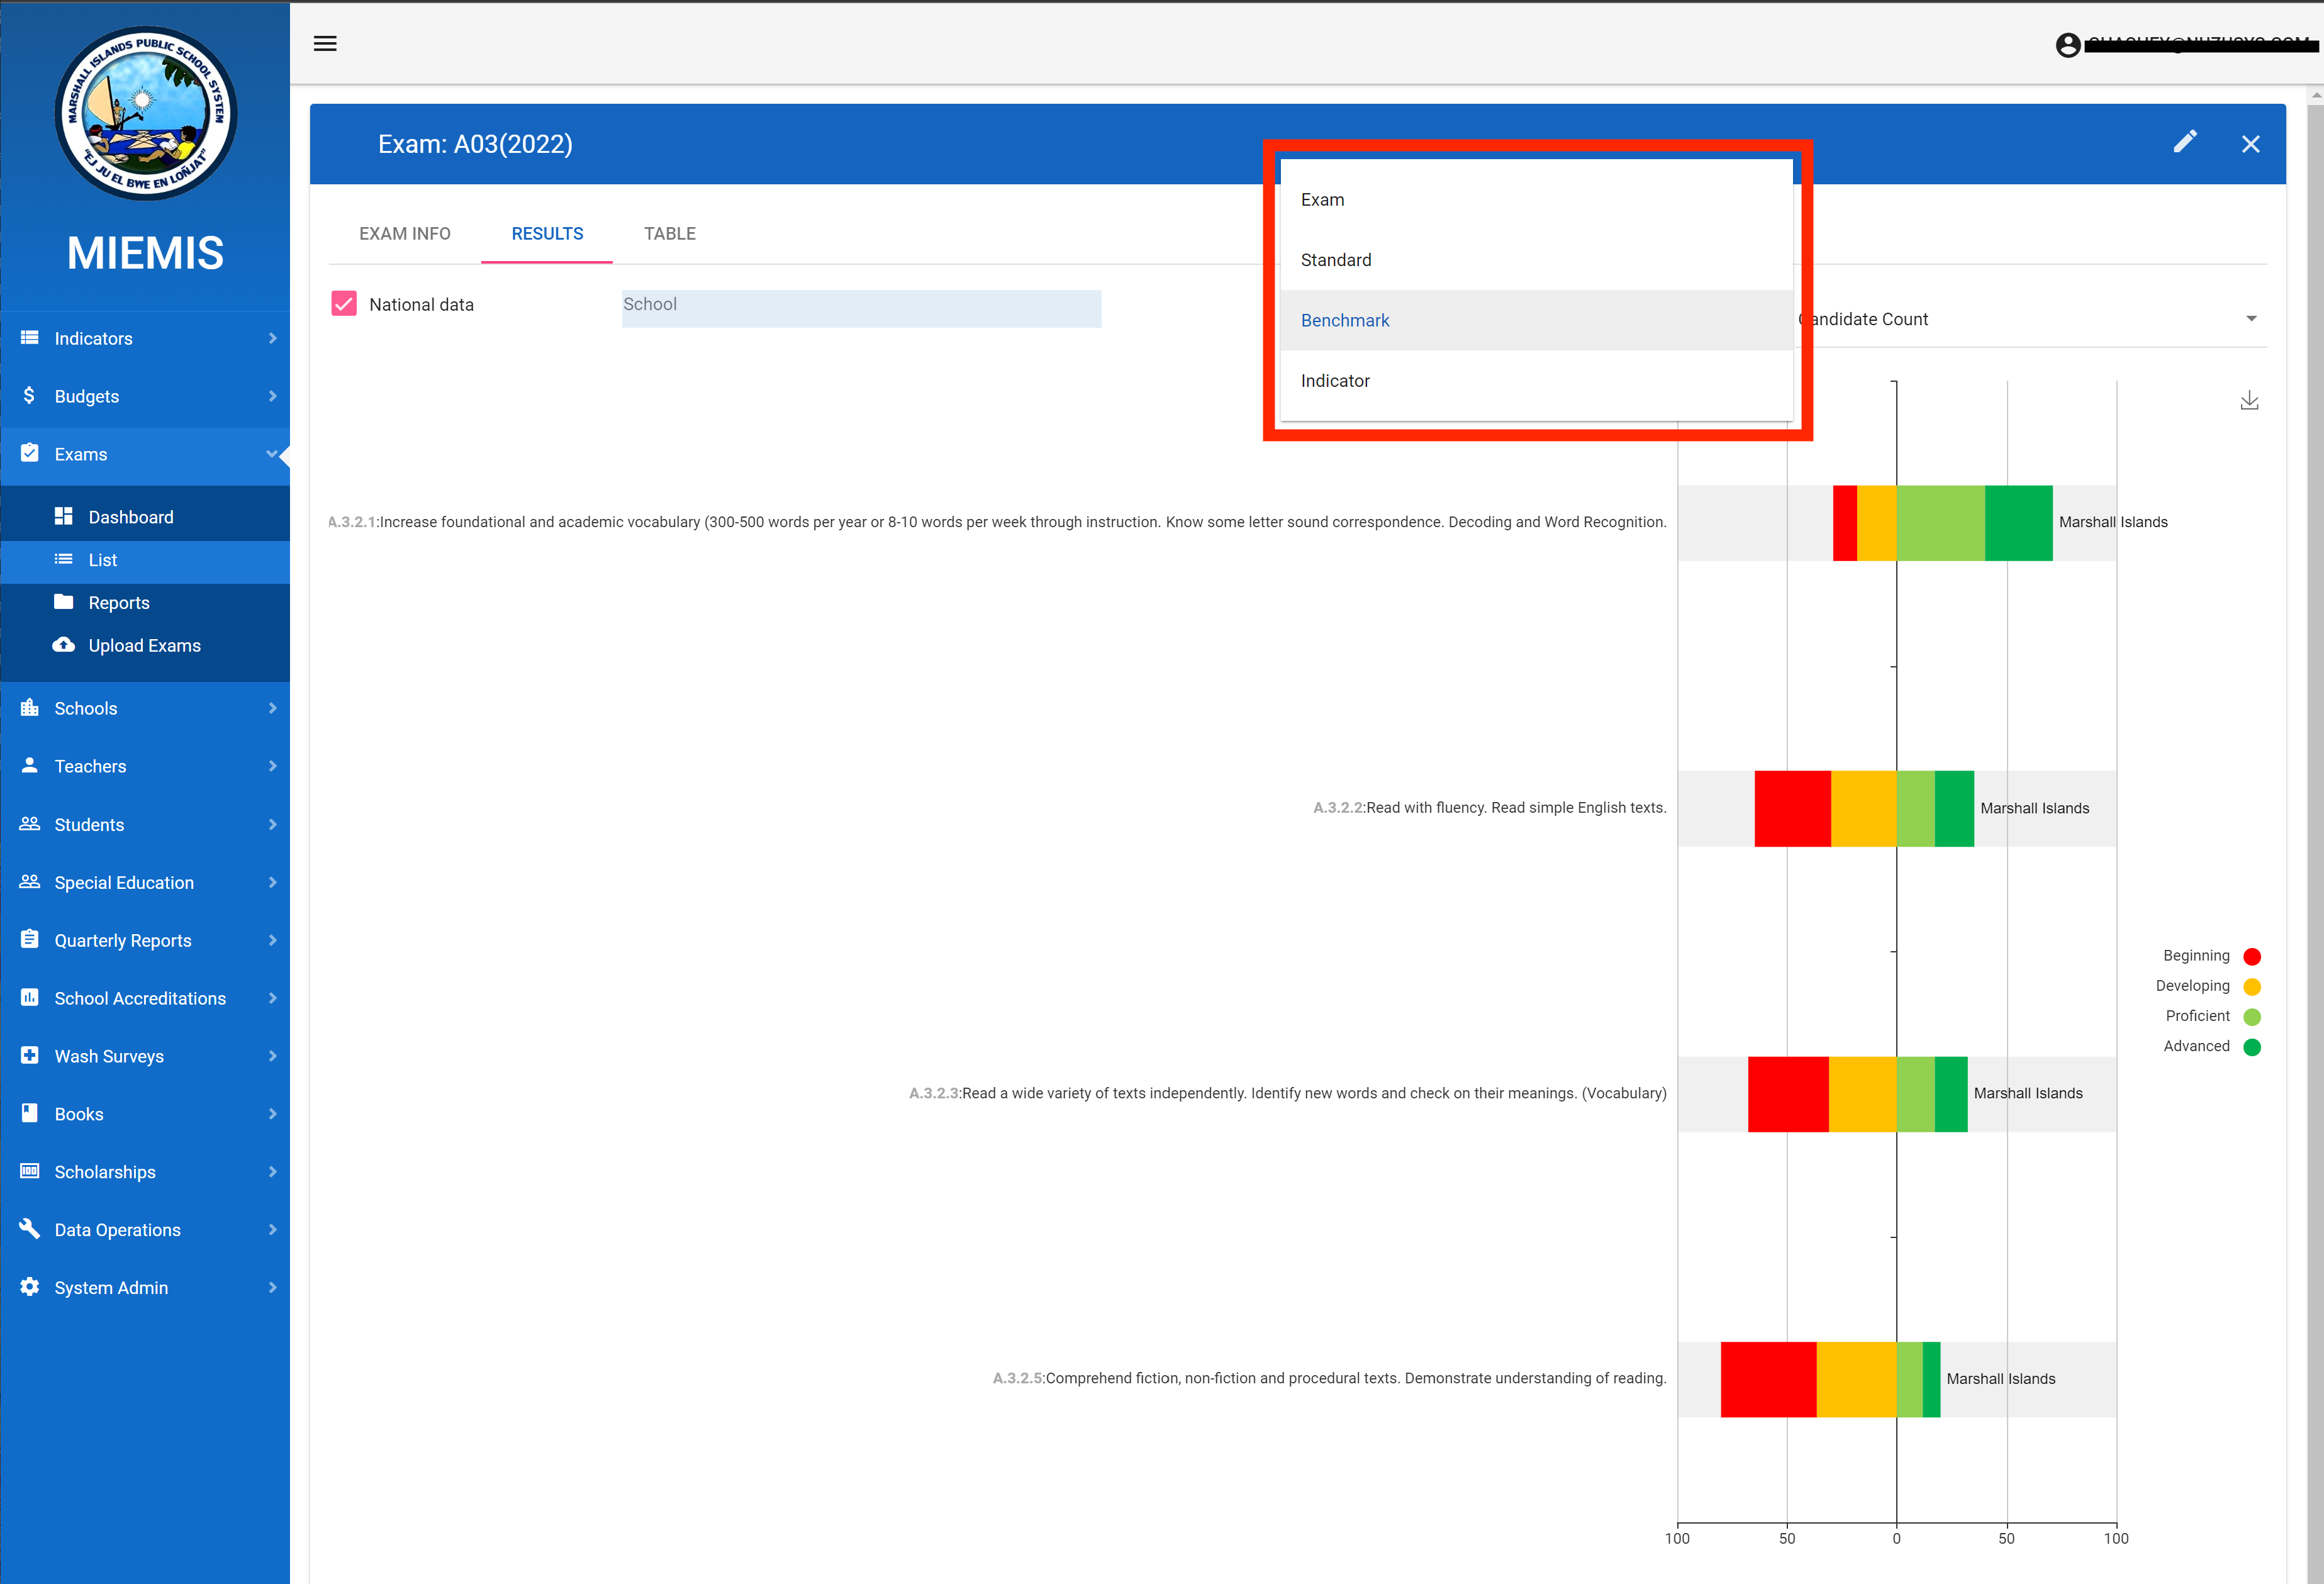
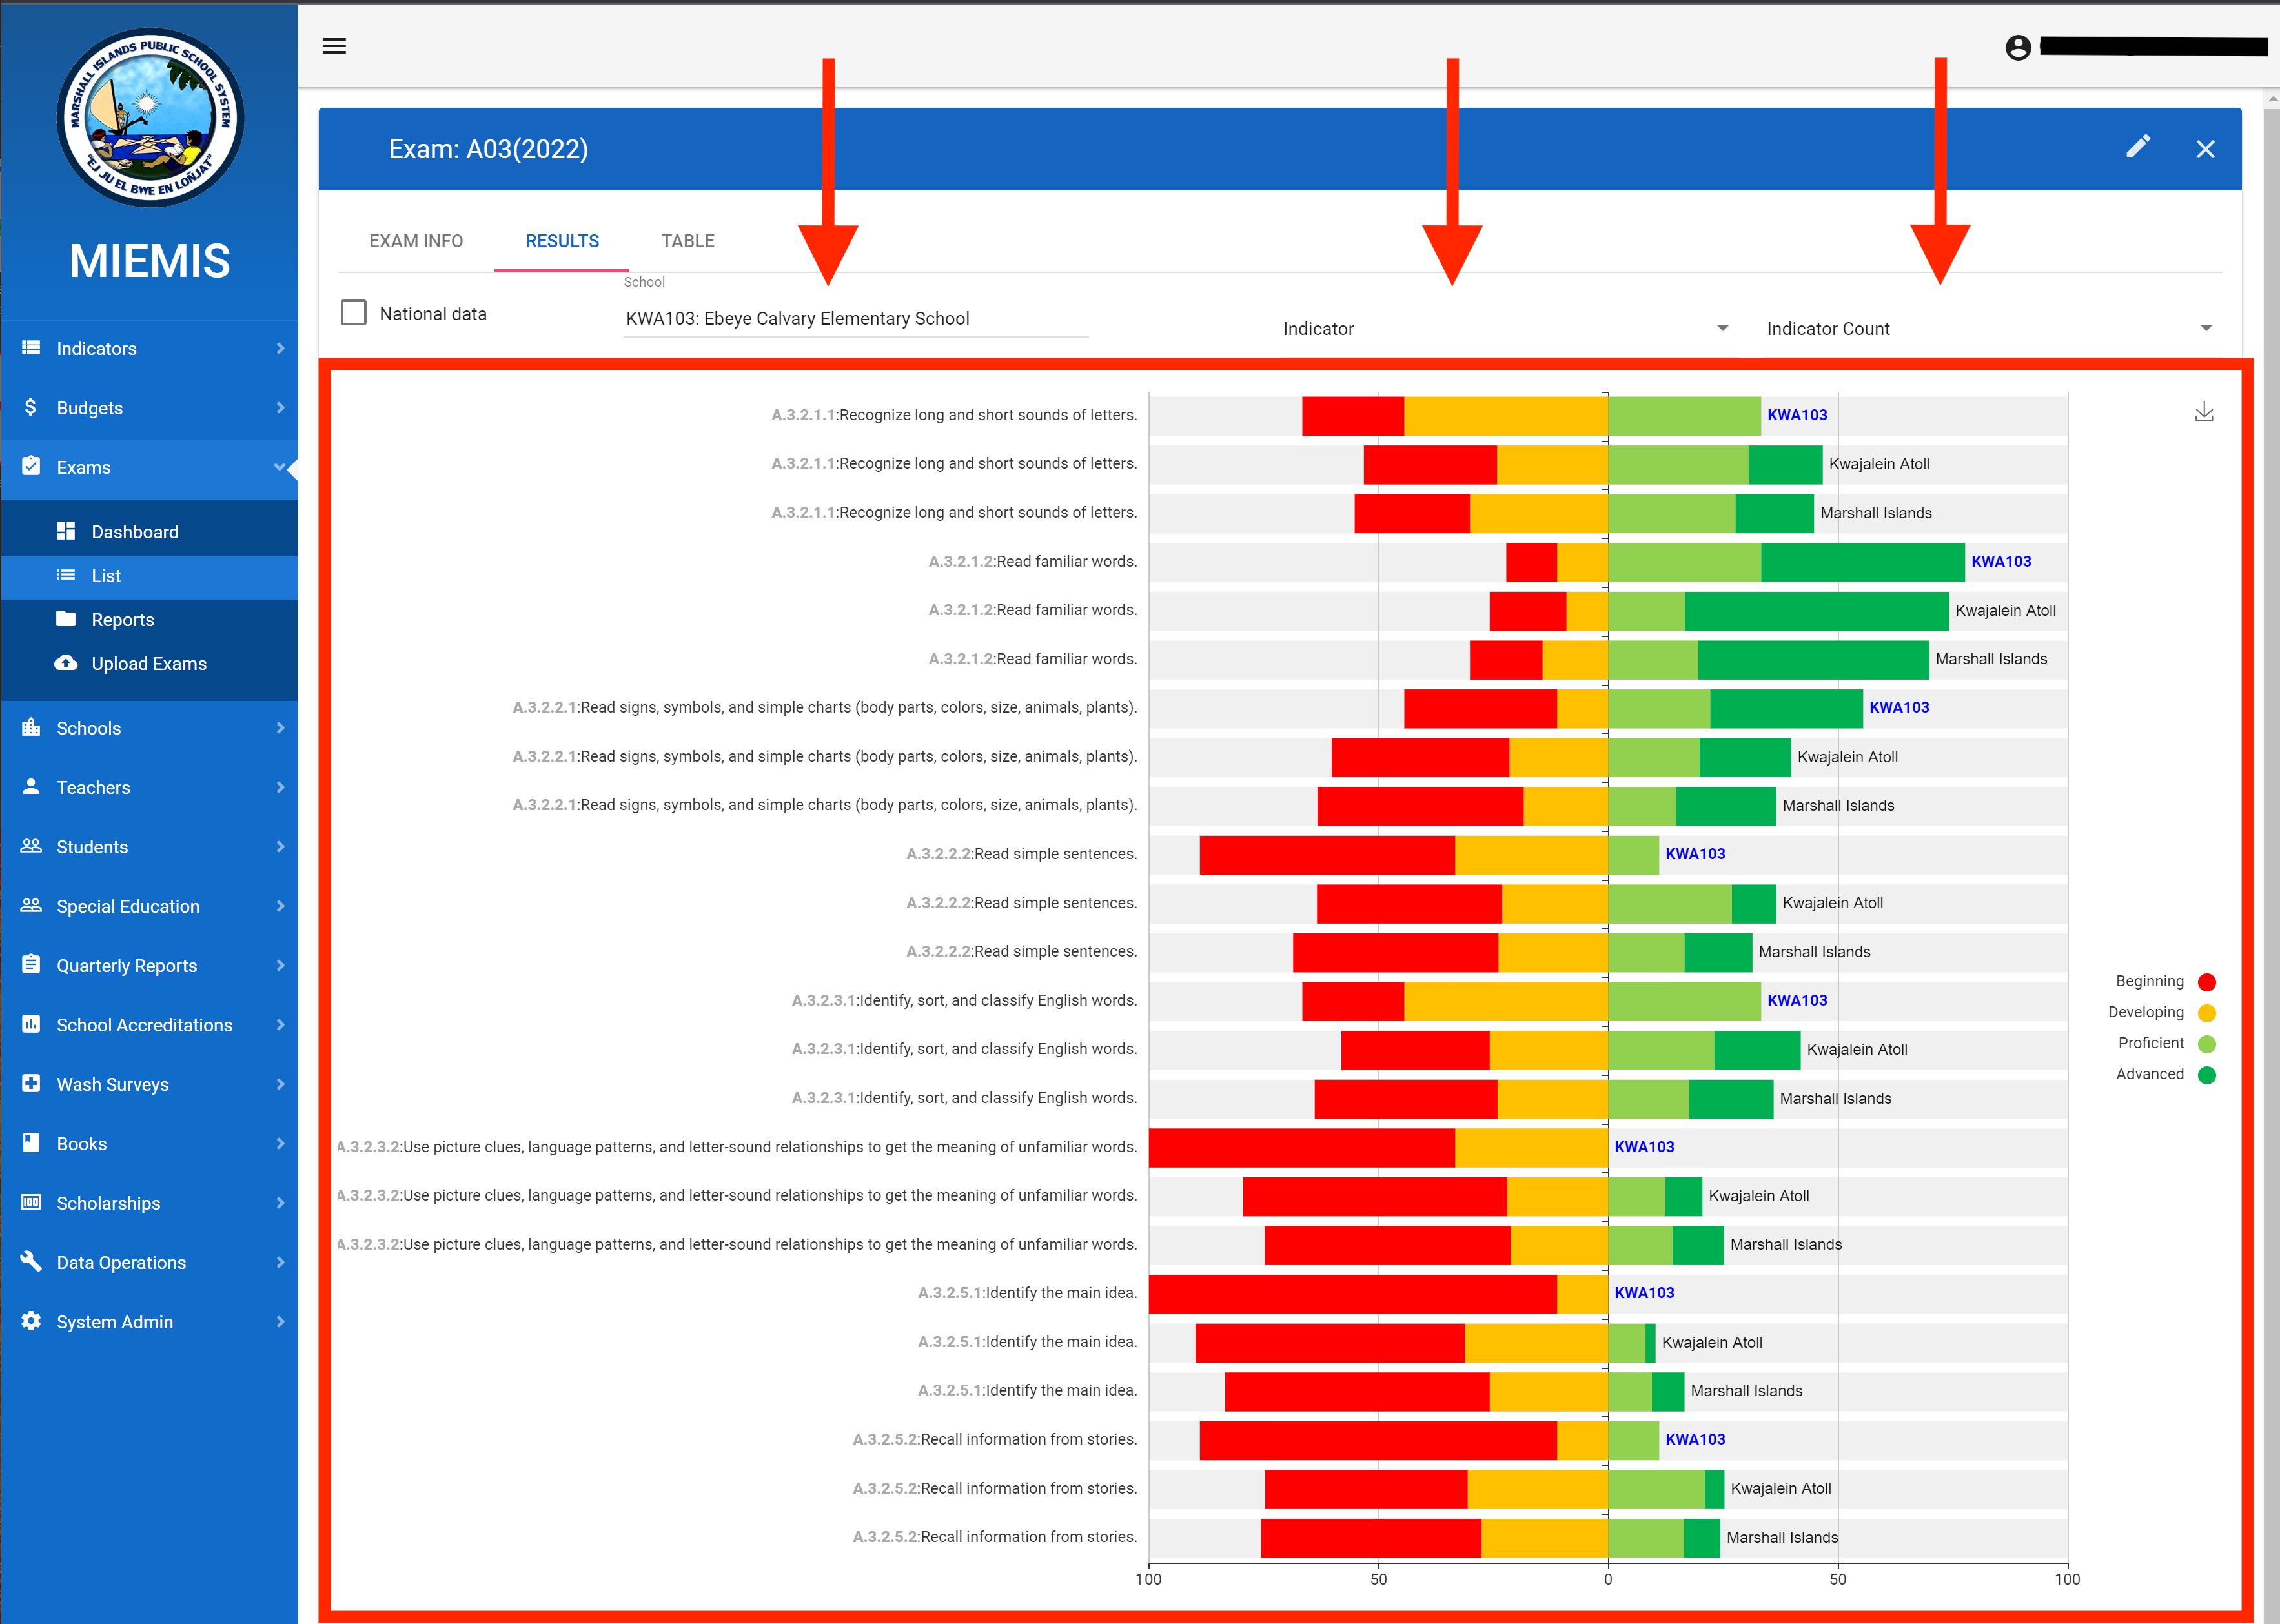
While there is only a single chart the analysis is quite powerful and flexible. The chart can dynamically re-draw to get you what you are looking for. For example, as shown below you can select at what hierarchical level you want to view the analysis (i.e. Exam (whole test), Standard, Benchmark or Indicator).
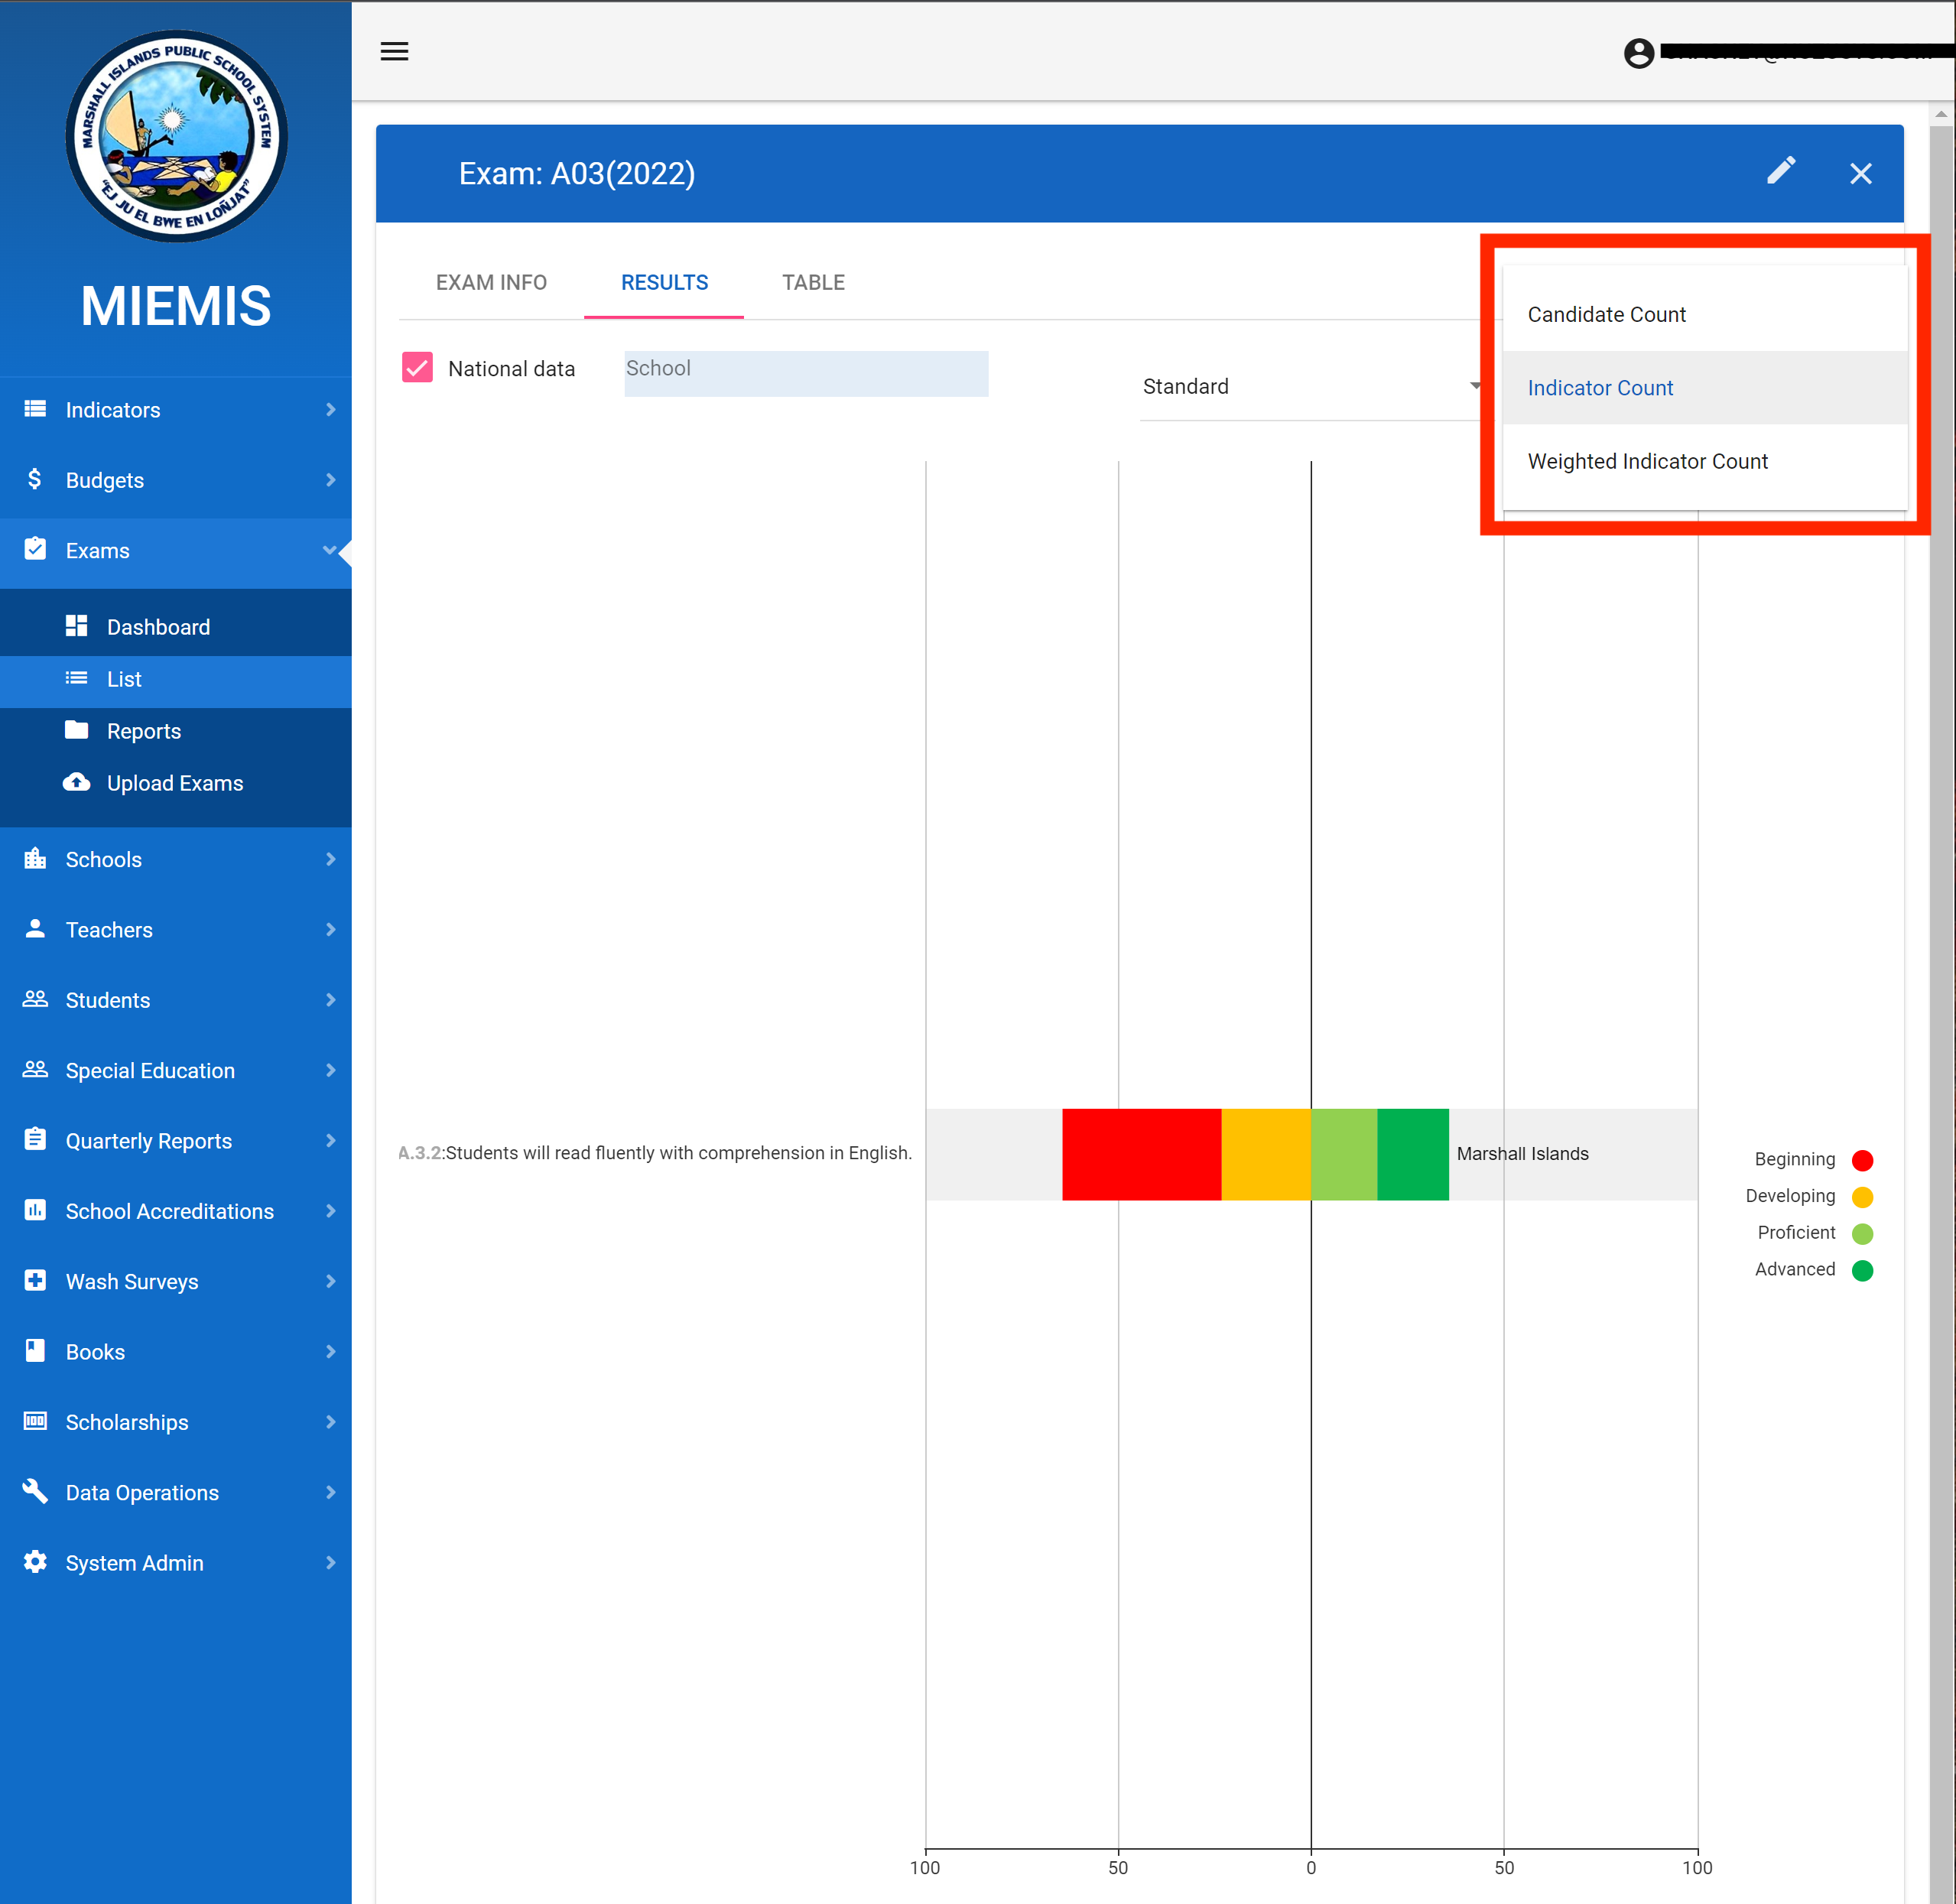
Then you can decide how you wish the data to be processed. The two most commonly used ones are Candidate Count and Indicator Count. Technical details on each are provided in EMIS Exams Module.
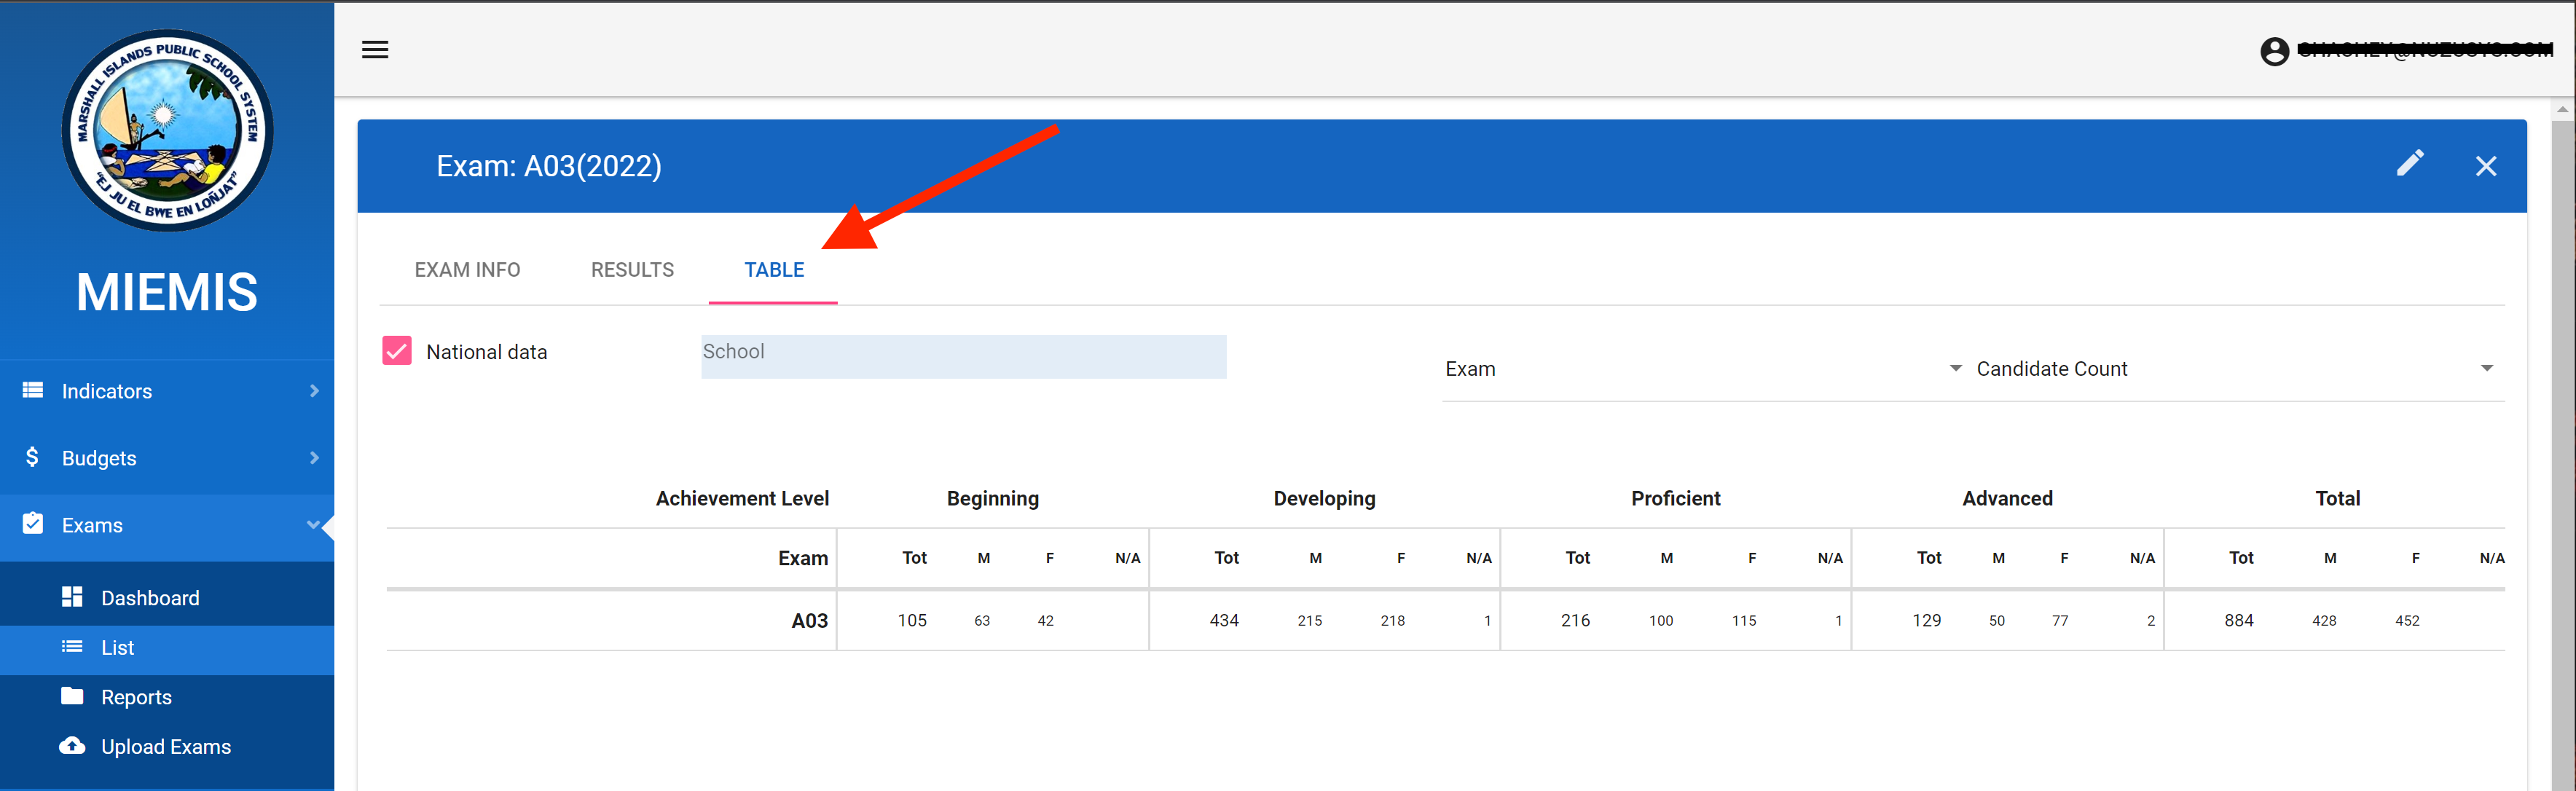
You can also view the data in a simple table format instead of chart with all the same powerful and flexible analysis supported.
This provides you data for the whole nation. But you can also view data for an individual school. Just uncheck the National data check box and start typing the school name to get a list of auto-complete school names,
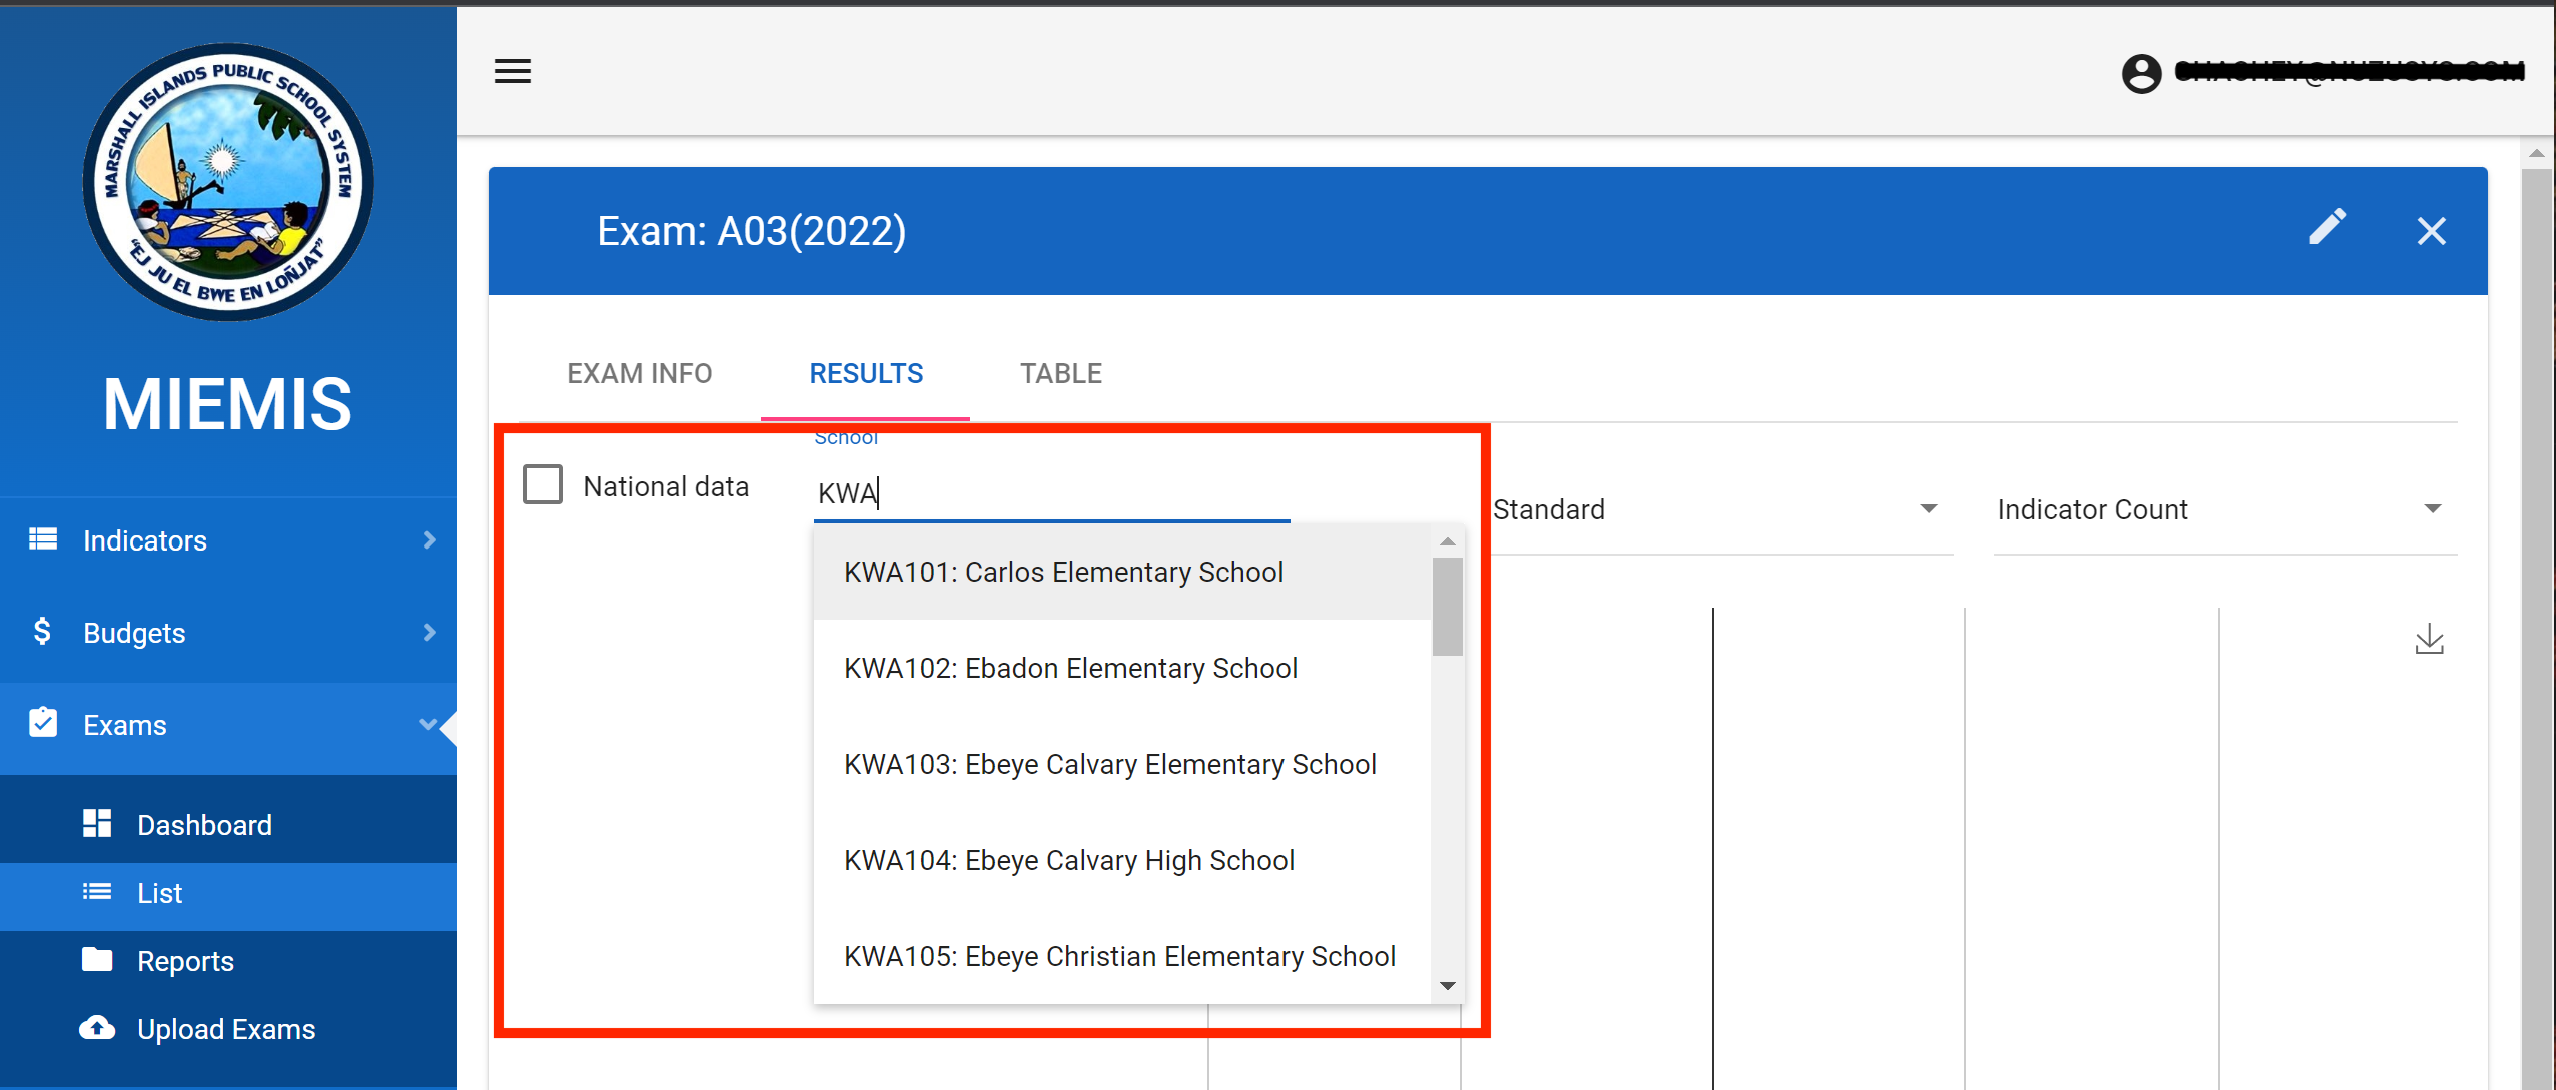
Again, the same flexibility is available here. For example, below we are viewing results for the school called Ebeye Calvary Elementary School, Indicator analysis using the Indicator Count method.
Test Analysis
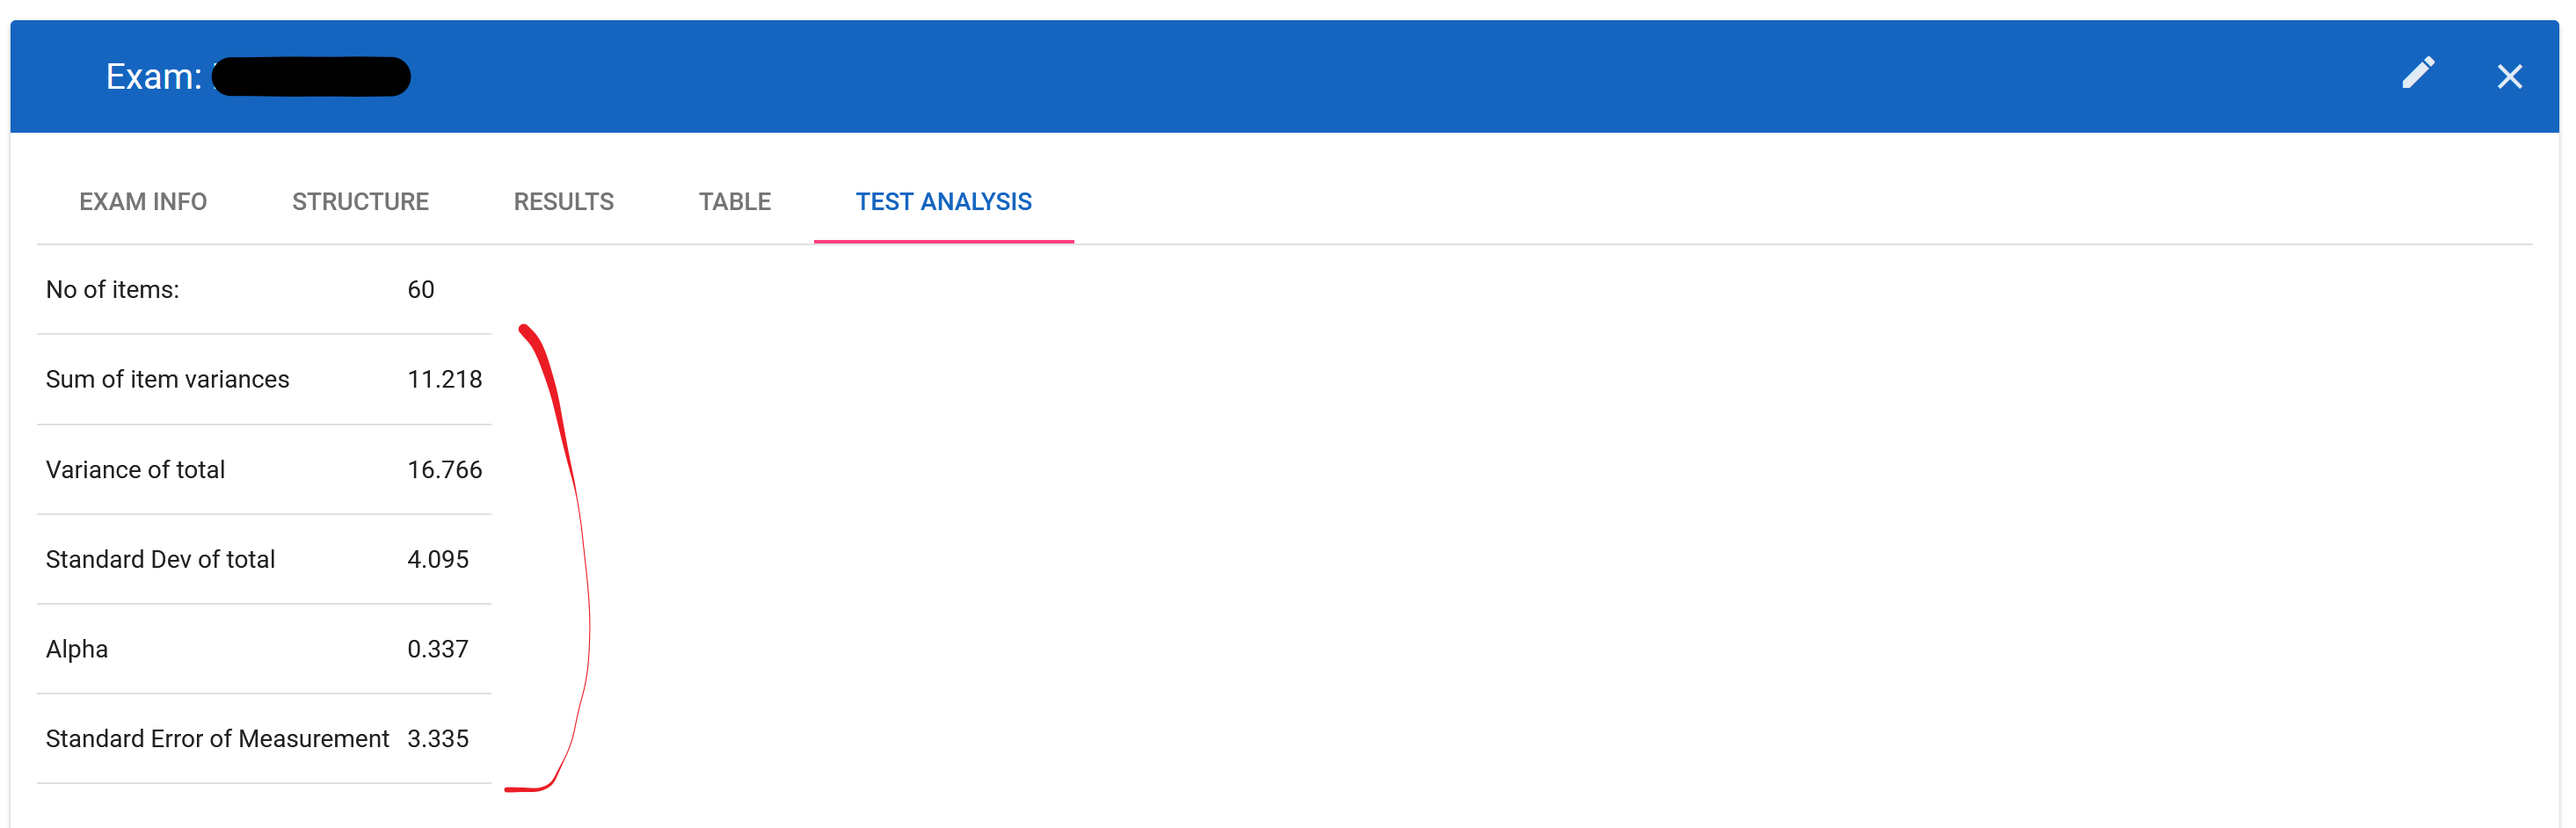
This is another useful feature of the Exam module. It can provide some test and test item analysis. Some statistics are provided to measure the performance of the test as a whole. Those are at the top of the page as shown below.
There will be discussed in following sections very briefly.
No of Items
Is merely the number of items (aka. questions) on the test.
Sum of Item Variances
Is simply the sum of the variance of each item (i.e. question) on the test. The variance is a measure of variability (i.e. dispersion), in this case how much the correct vs incorrect scores vary across all candidates for a given item. The theoretical lowest value is no variability at all (i.e. 0) while the highest value would be 0.25. Therefore, the scale of the sum of Item Variances for a 60 item test would be 15.
Variance of Total
The variance of total is the variance of the dataset of all total scores of the candidates. For example, in this test there were 689 candidates and 60 items. Each of the candidate will have scored a number of correct items (e.g. a student with 45 out of 60 for a score of 45). The dataset would look like {45, 34, 51, 23,…, 39} with 689 scores. The variance of total is how much the total candidate scores vary. The lower bound would be 0 with absolutely no dispersion (all the same results) and the upper bound would be an extremely high dispersion (theoretically as high as 900 for this particular dataset of 60 possible different scores for a large enough dataset (i.e. hundreds of candidates). The lower and more specifically the upper bound of this measure is full dependent on the range of the dataset (e.g. 0-60 as possible score).
Standard Deviation of Total
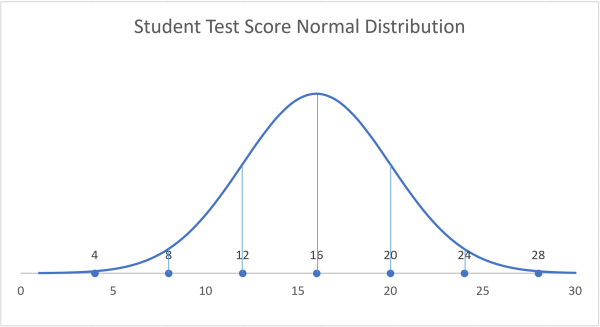
The standard deviation is also a measure of variability (i.e. dispersion) of values in a dataset. It assesses how far a data point likely falls from the mean (i.e. average).
The standard deviation along with the mean can then produce the commonly used normal distribution visually showing the probability of how far student's score falls from the mean (average).
Cronbach's Alpha (Alpha)
The Cronbach's Alpha is used as a reliability coefficient and ranges in value from 0 (no reliability) to 1.00 (perfect reliability). Care must be taken when interpreting results of statistics. just because of alpha would be low those not mean it is not a useful test in the context of its use. The general guidelines you can use the following scale from ScorePak®.
- .90 and above: Excellent reliability; at the level of the best standardized tests
- .80 – .90: Very good for a classroom test
- .70 – .80: Good for a classroom test; in the range of most. There are probably a few items which could be improved.
- .60 – .70: Somewhat low. This test needs to be supplemented by other measures (e.g., more tests) to determine grades. There are probably some items which could be improved.
- .50 – .60: Suggests need for revision of test, unless it is quite short (ten or fewer items). The test definitely needs to be supplemented by other measures (e.g., more tests) for grading.
- .50 or below: Questionable reliability. This test should not contribute heavily to the course grade, and it needs revision.
Standard Error of Measurement
A standard error of measurement estimates the variation around a “true” score for an individual when repeated measures are taken.
Item Difficulty
Simply put, the item difficulty is the percentage of students who answer an item correctly. The item difficulty index ranges from 0 to 100; the higher the value, the easier the question.
Assessed difficulty based on percentage of correct answers using the following arbitrary classification.
- Less than a third (33.33%) of candidates got the correct answer
- More than two thirds (66.66%) of candidates got the correct answer
- Between a third and two thirds (less than 66.66% and more than 33.33%) of candidates got the correct answer
Expected difficulty is directly taken from the item meta data (e.g. Item_001_MS1001010101e_ddd) where the e indicates “Easy”).
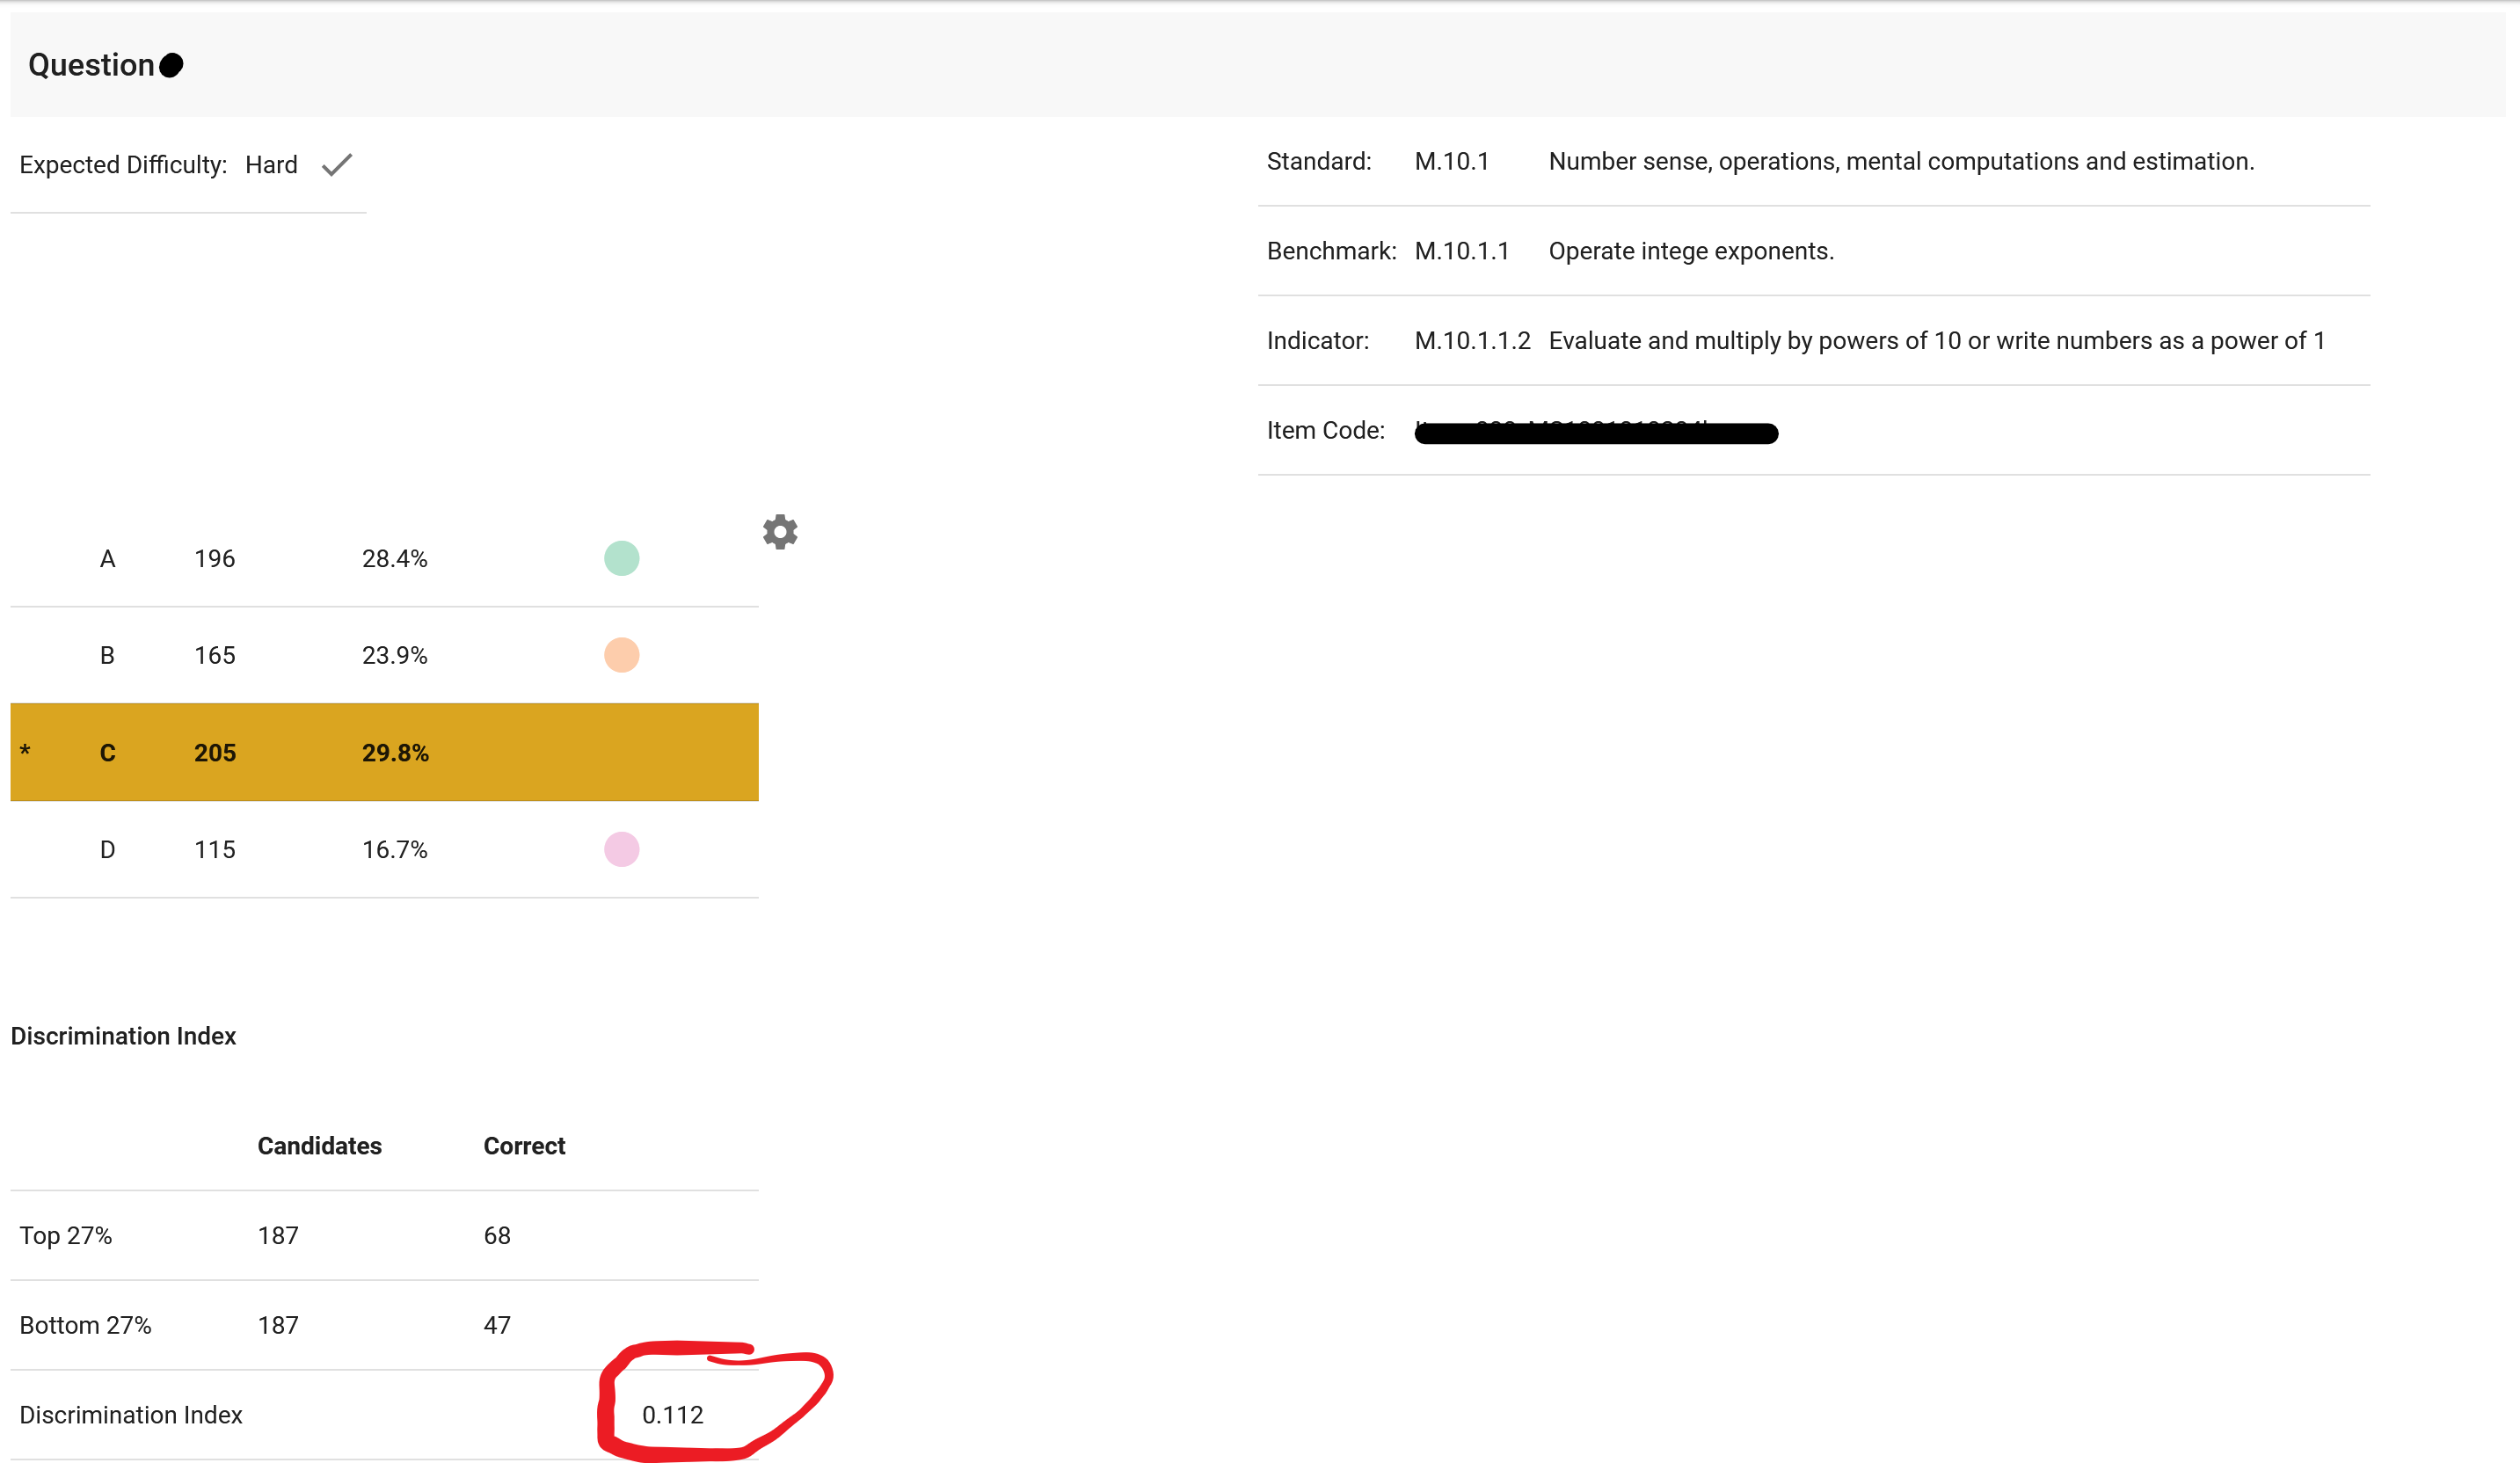
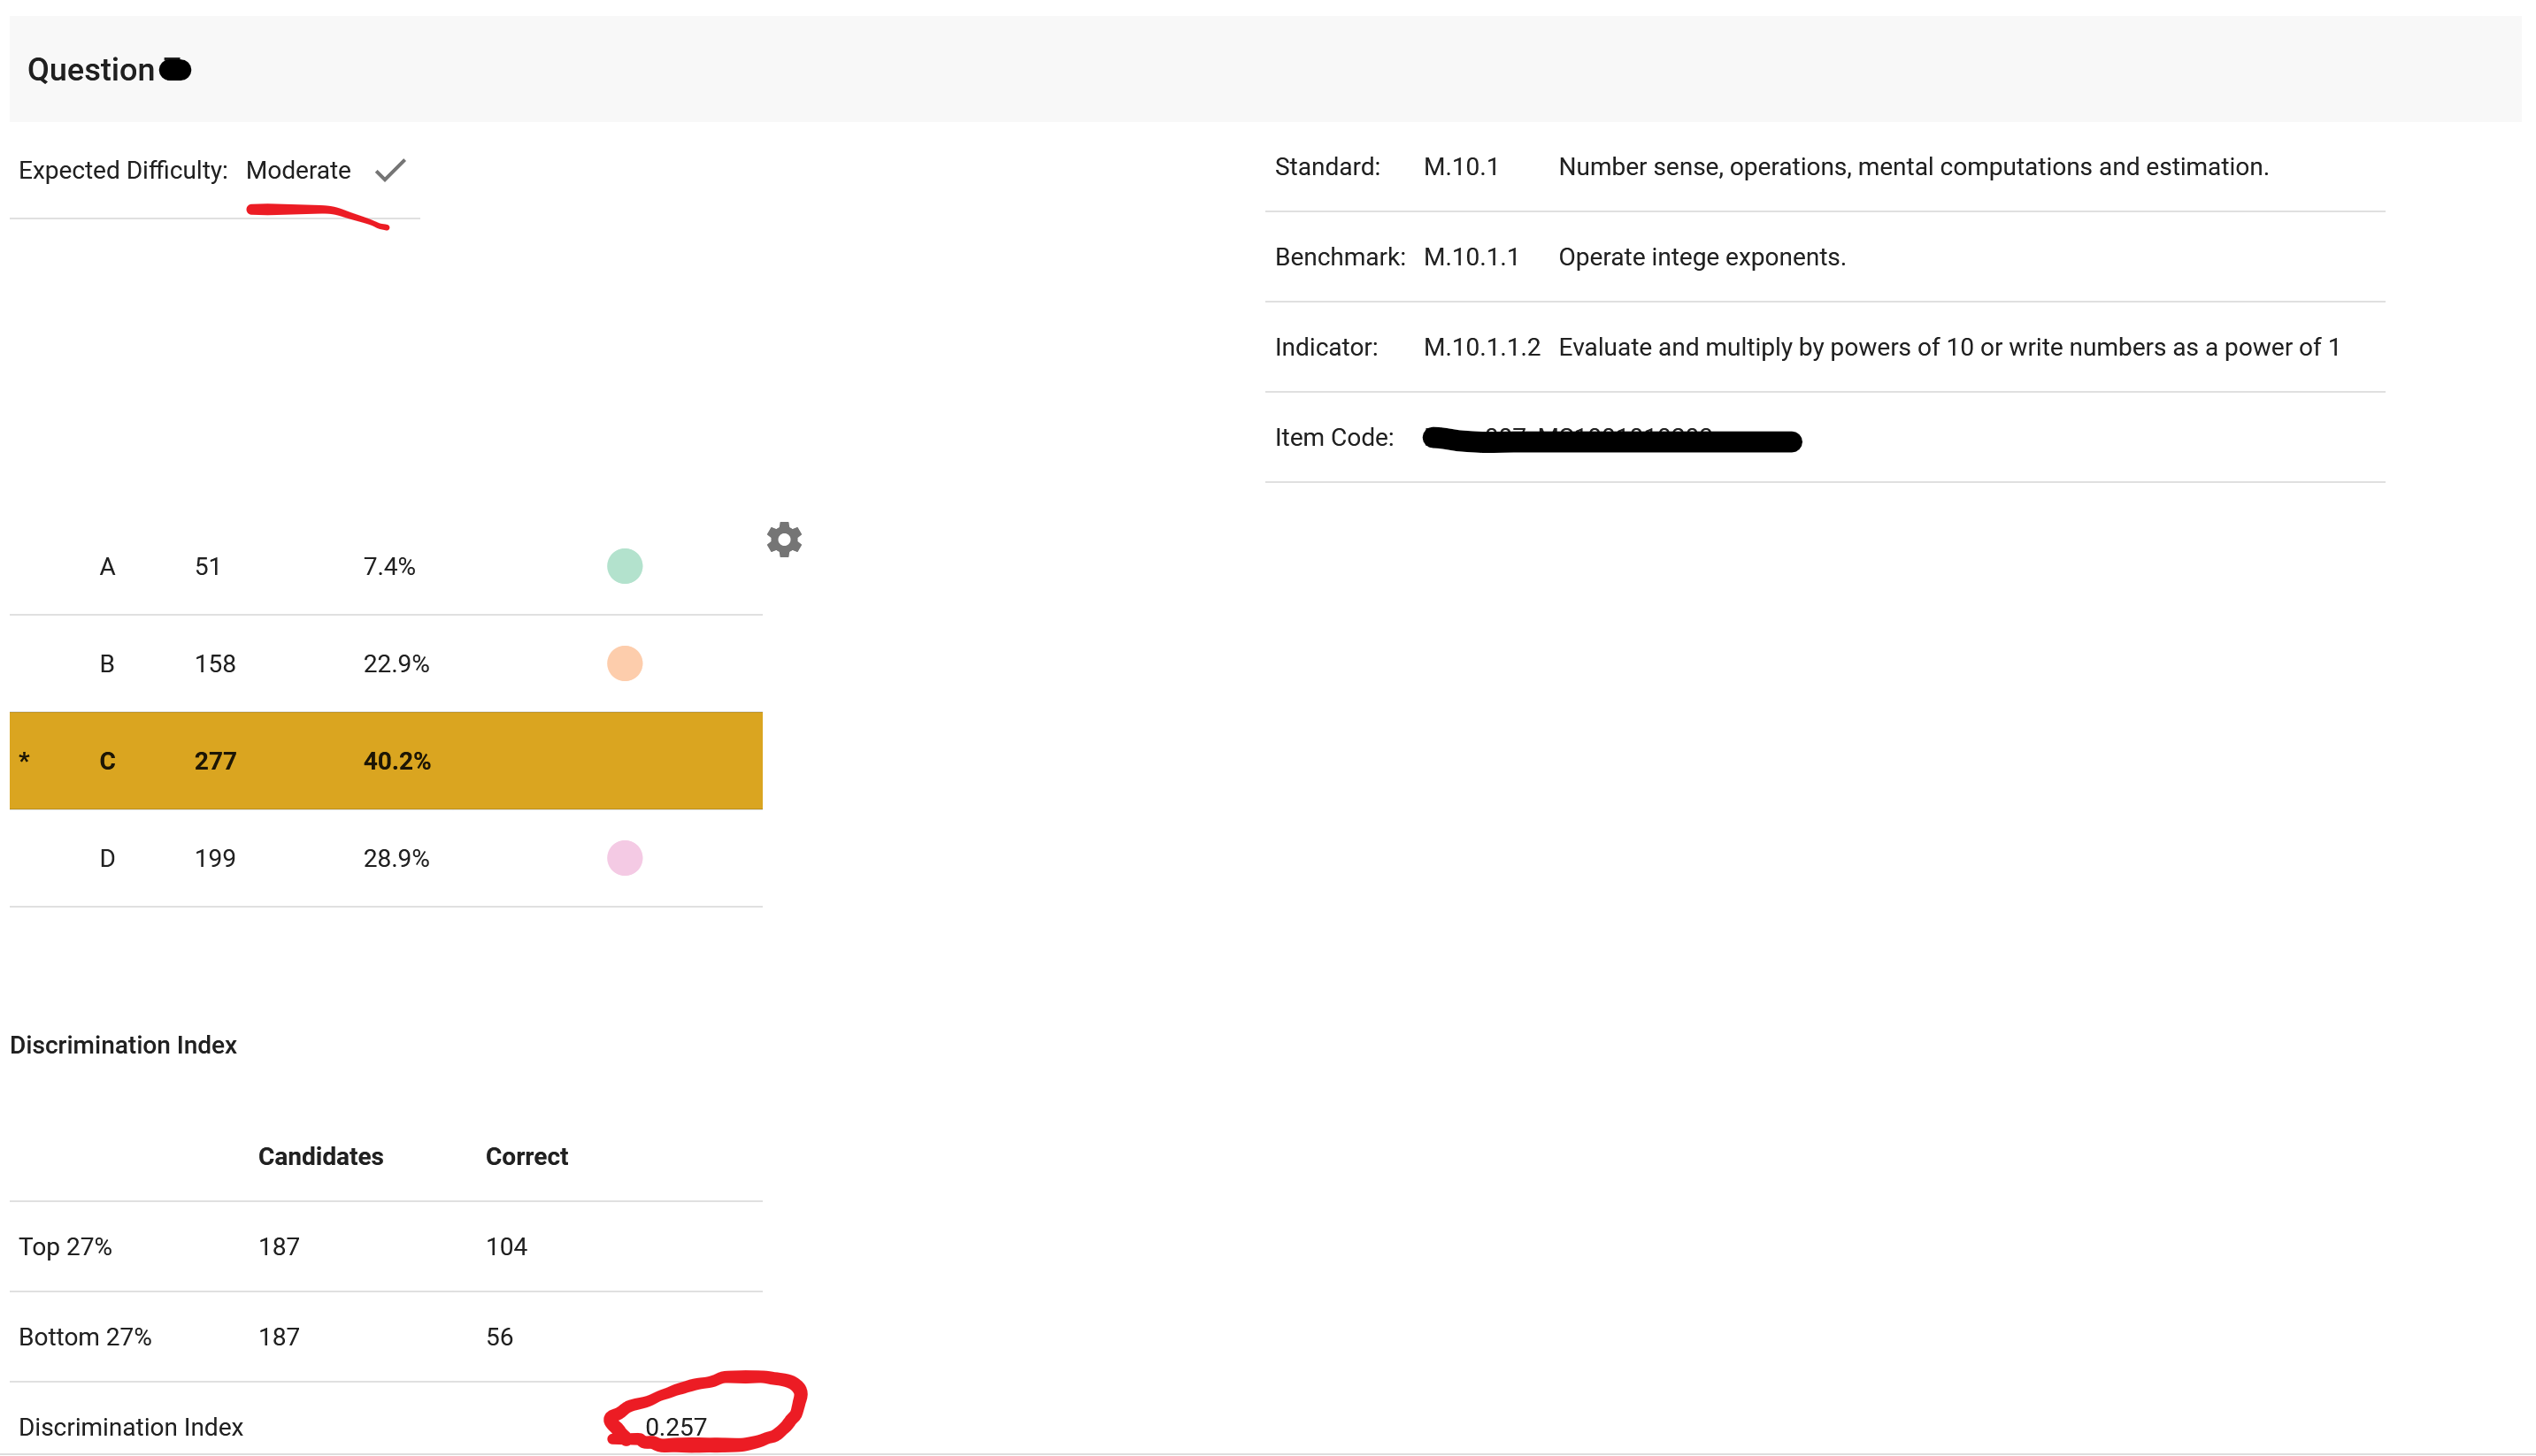
When the assessed difficulty is the same and the expected difficult, you will see a checkmark as shown below. This indicates the results are as expected.
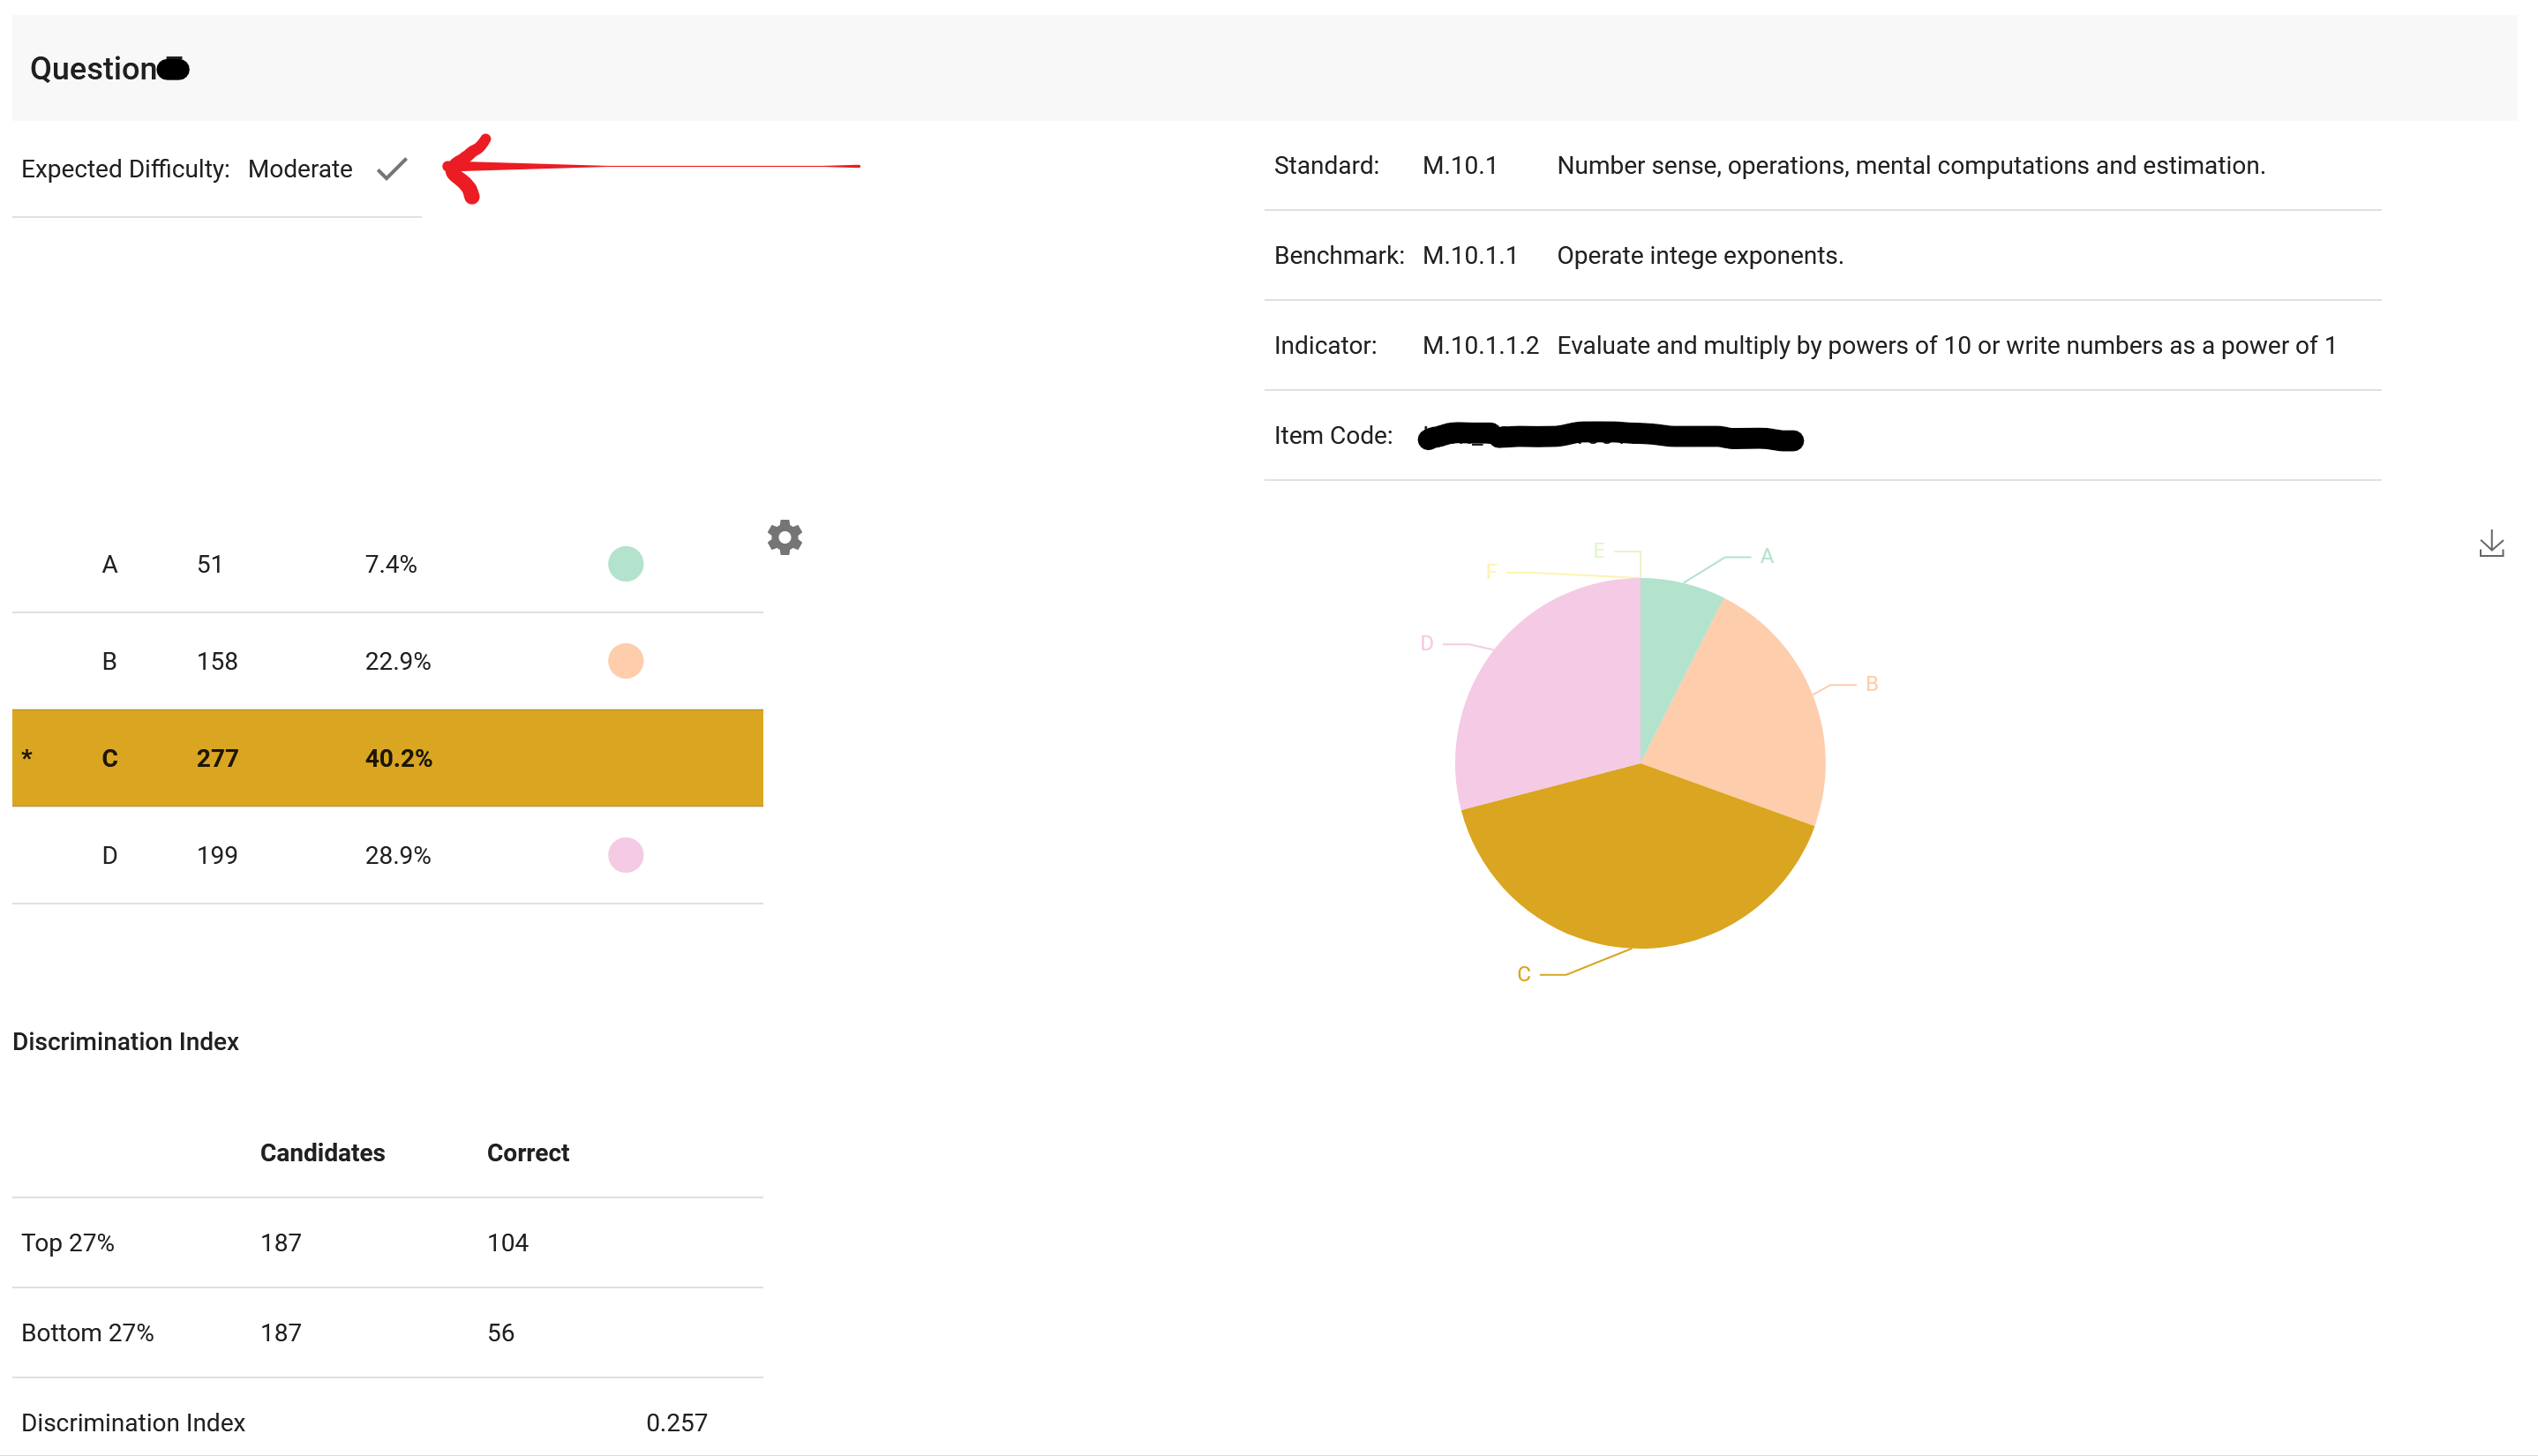
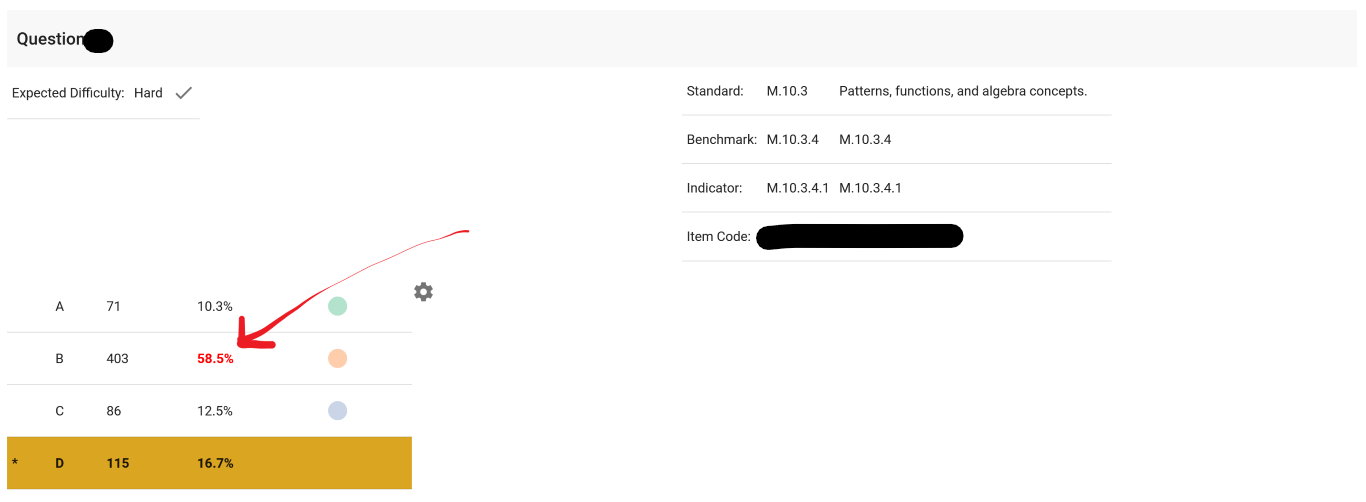
Note also that the questions results will be flagged in red when there are more candidates answering that one answer then the actual correct answer. For example, below 58.5% of candidates answered “B” to an item with correct answer of “D”. When this happens further examination may be desired.
Item Discrimination Index
The item's discrimination index is a measure of how well an item is able to distinguish between candidates who are knowledgeable and those who are not (more here [BrownDI2020]). A negative discrimination index may indicate that the item is measuring something other than what the rest of the test is measuring. Optimally an item should have a positive discrimination index of at least 0.2, which indicates that high scorers have a high probability of answering correctly and low scorers have a low probability of answering correctly.
For example, in the figure below, the discrimination index is 0.112 which is below 0.2 and therefore no doing a great job at distinguishing knowledgeable candidates from candidates who are not. Another indication this is not a great item is the difficulty. The expected and assessed difficulty is a match but there are many low scorers who got the correct answer when this should have been a hard question. This item should likely be replaced.
On the other hand, the following item has a discrimination index of 0.257 above 0.2 and this does a better job distinguishing knowledgeable candidates from candidates who are not.
More on test analysis can be found here [UWItemAnalysis]
Dashboard Analysis
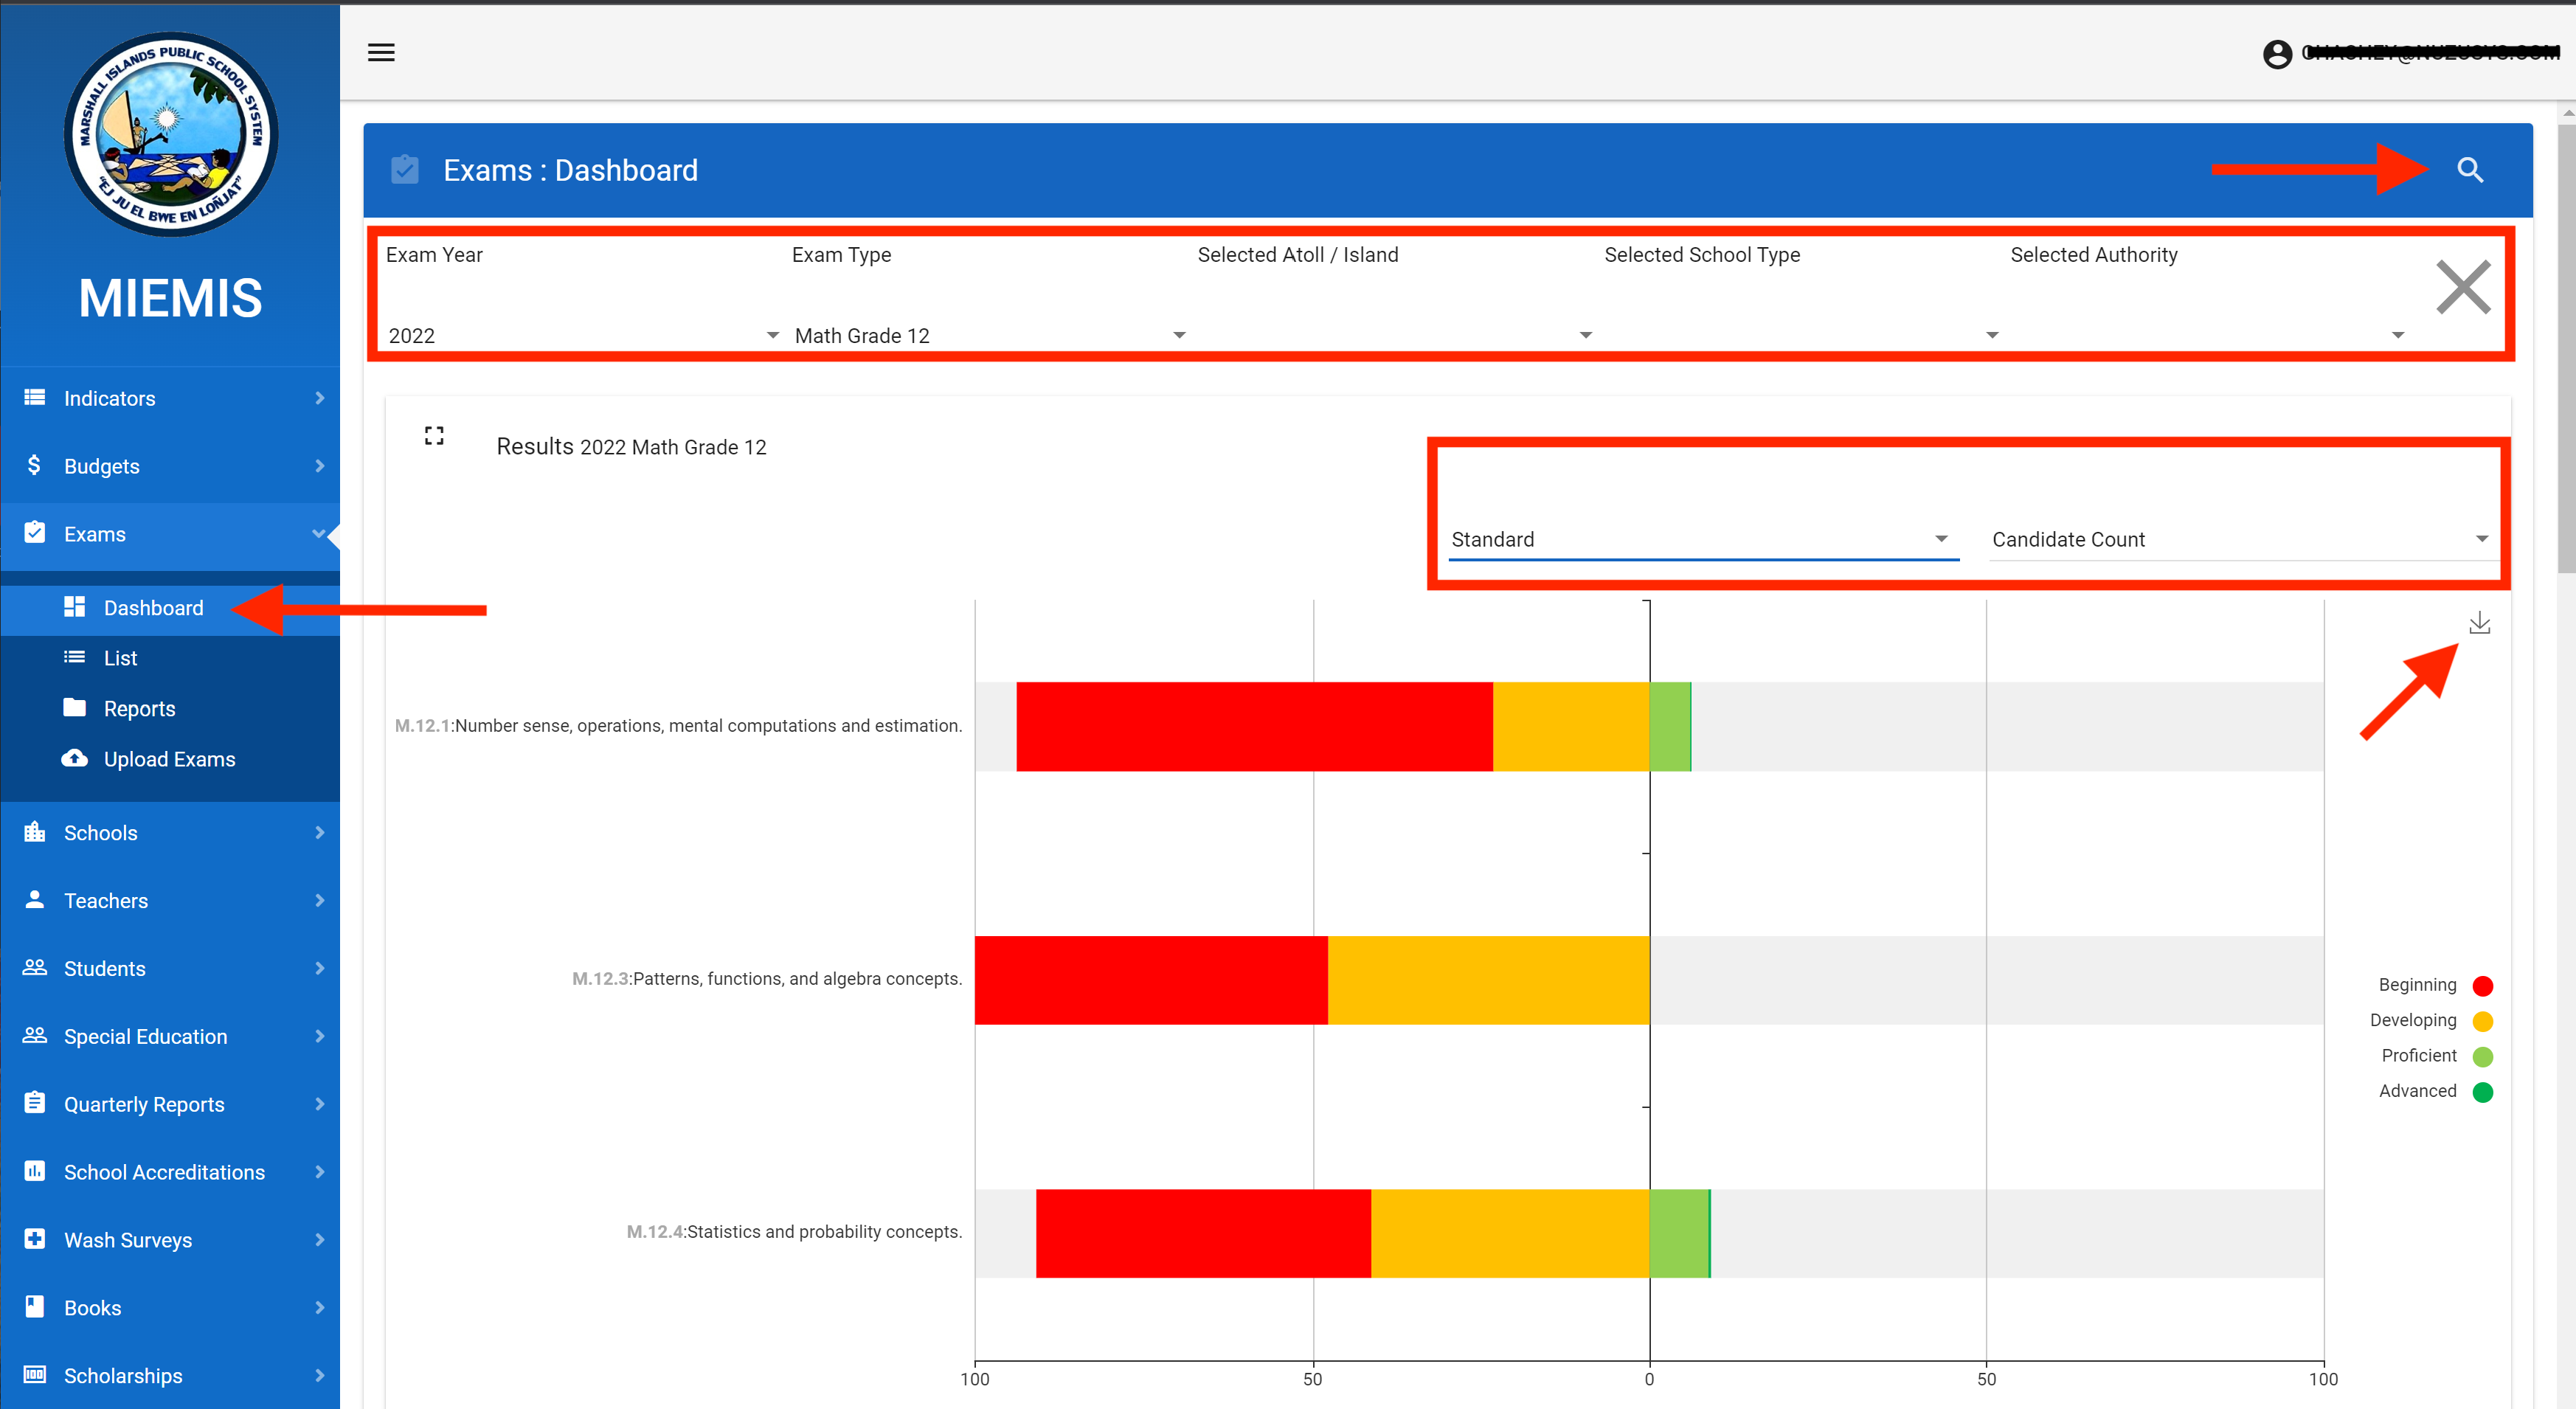
If you would like additional flexibility of analysis you can browse to the Exams → Dashboard page. There you have the usual filters where you can view individual districts (i.e. states, atolls, provinces, etc.), school types (e.g. public/private) and authority. Changing the top filters usually re-draw the whole page with only the filtered data.
All the same flexible of analysis is available for all the charts. That is, you can select to view the Exam, Standard, Benchmark or Indicator and chosen whether you want the results as computed as Candidate Count or Indicator Count.
You can also download the charts as images for inclusion in presentation, emails, reports, etc.
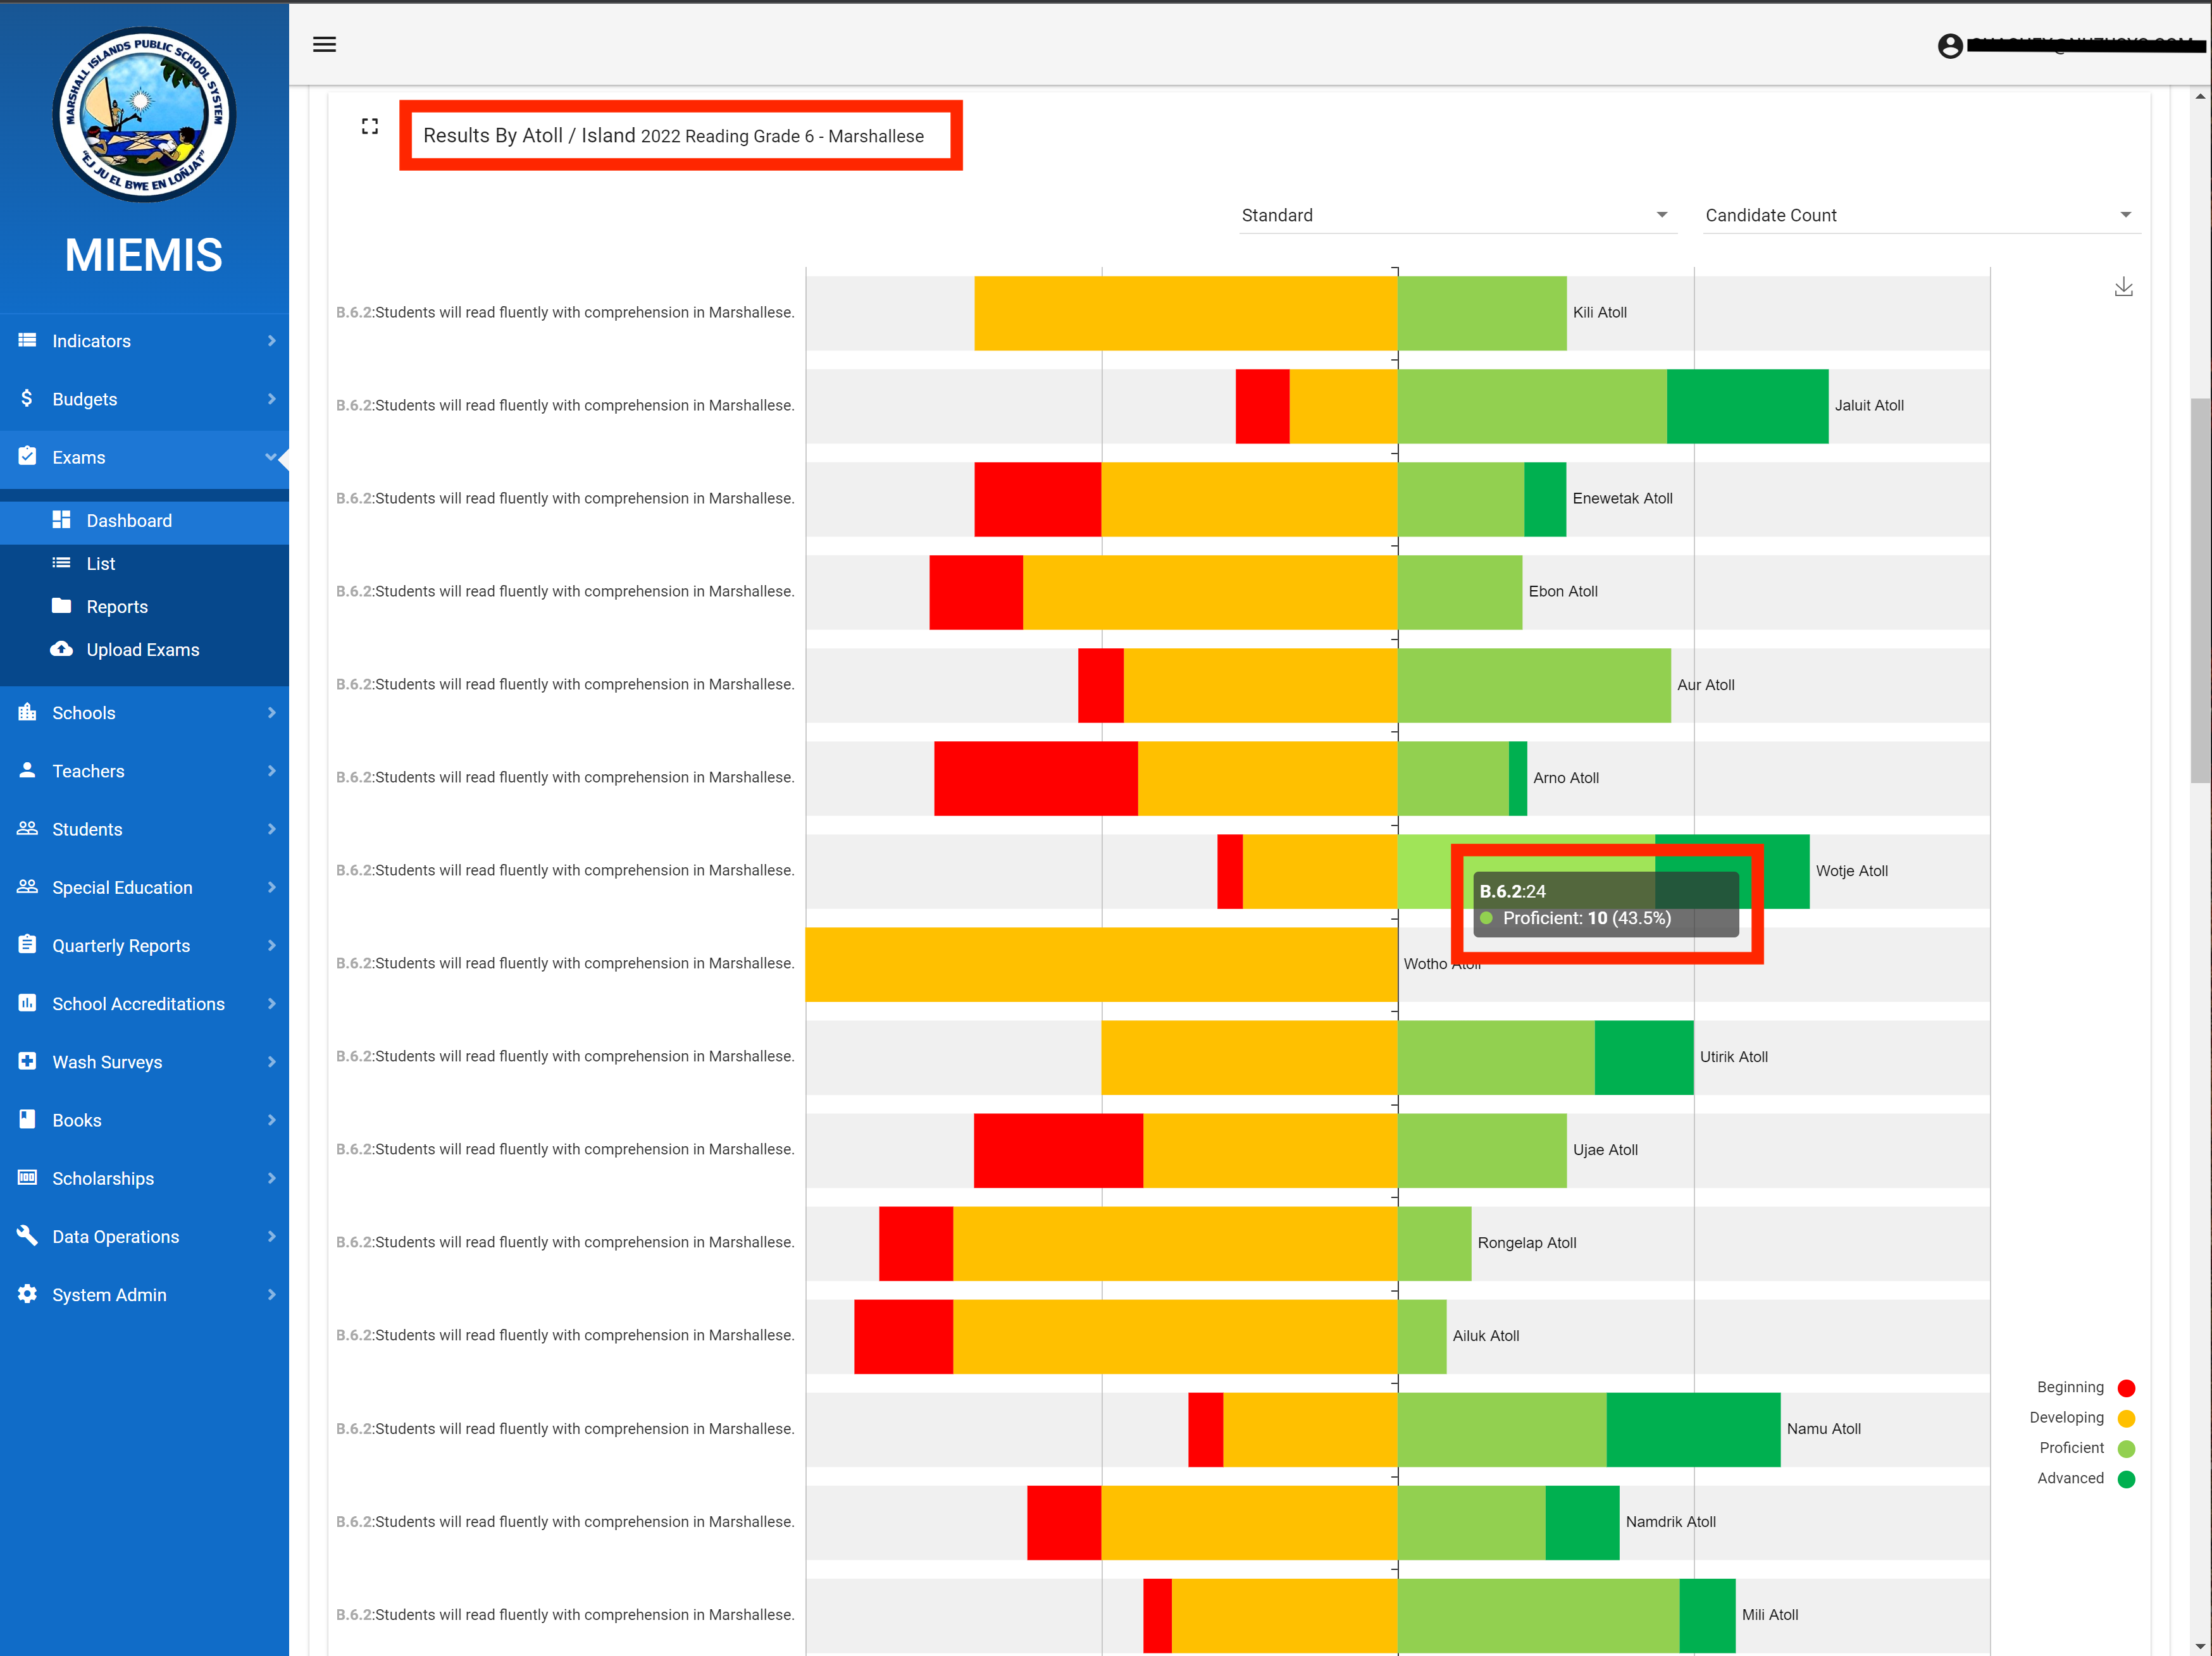
Scroll a little down and the next char shows the analysis of results with all the districts side by side. You can hover your mouse over any of the bar charts to get details about it also shown in the following screenshot.
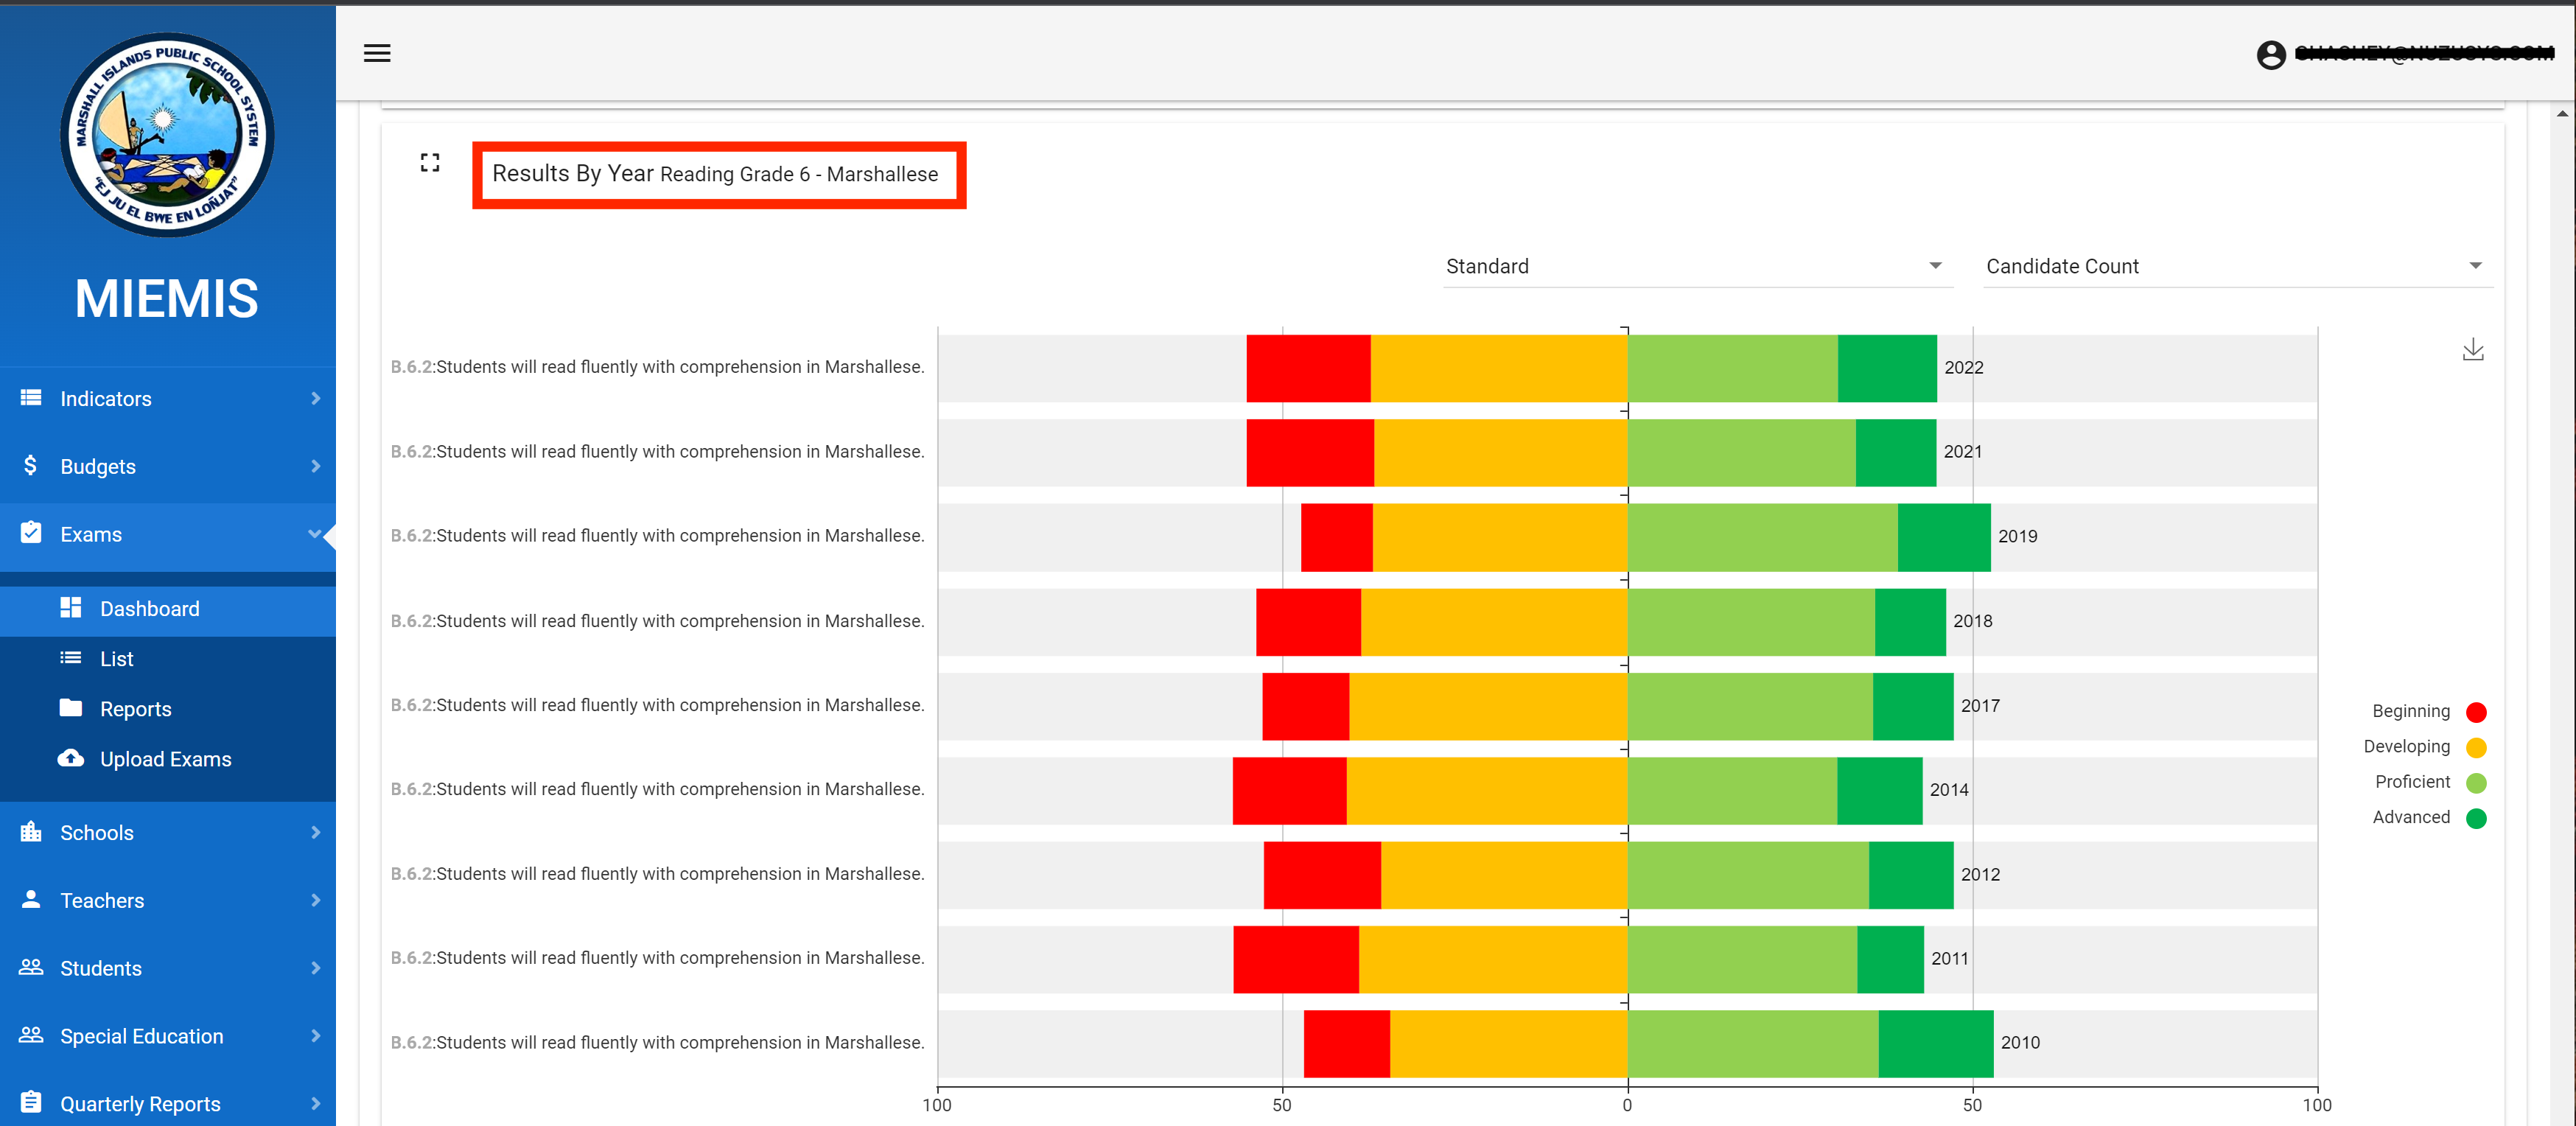
Scroll further down and you can see the results over the years.
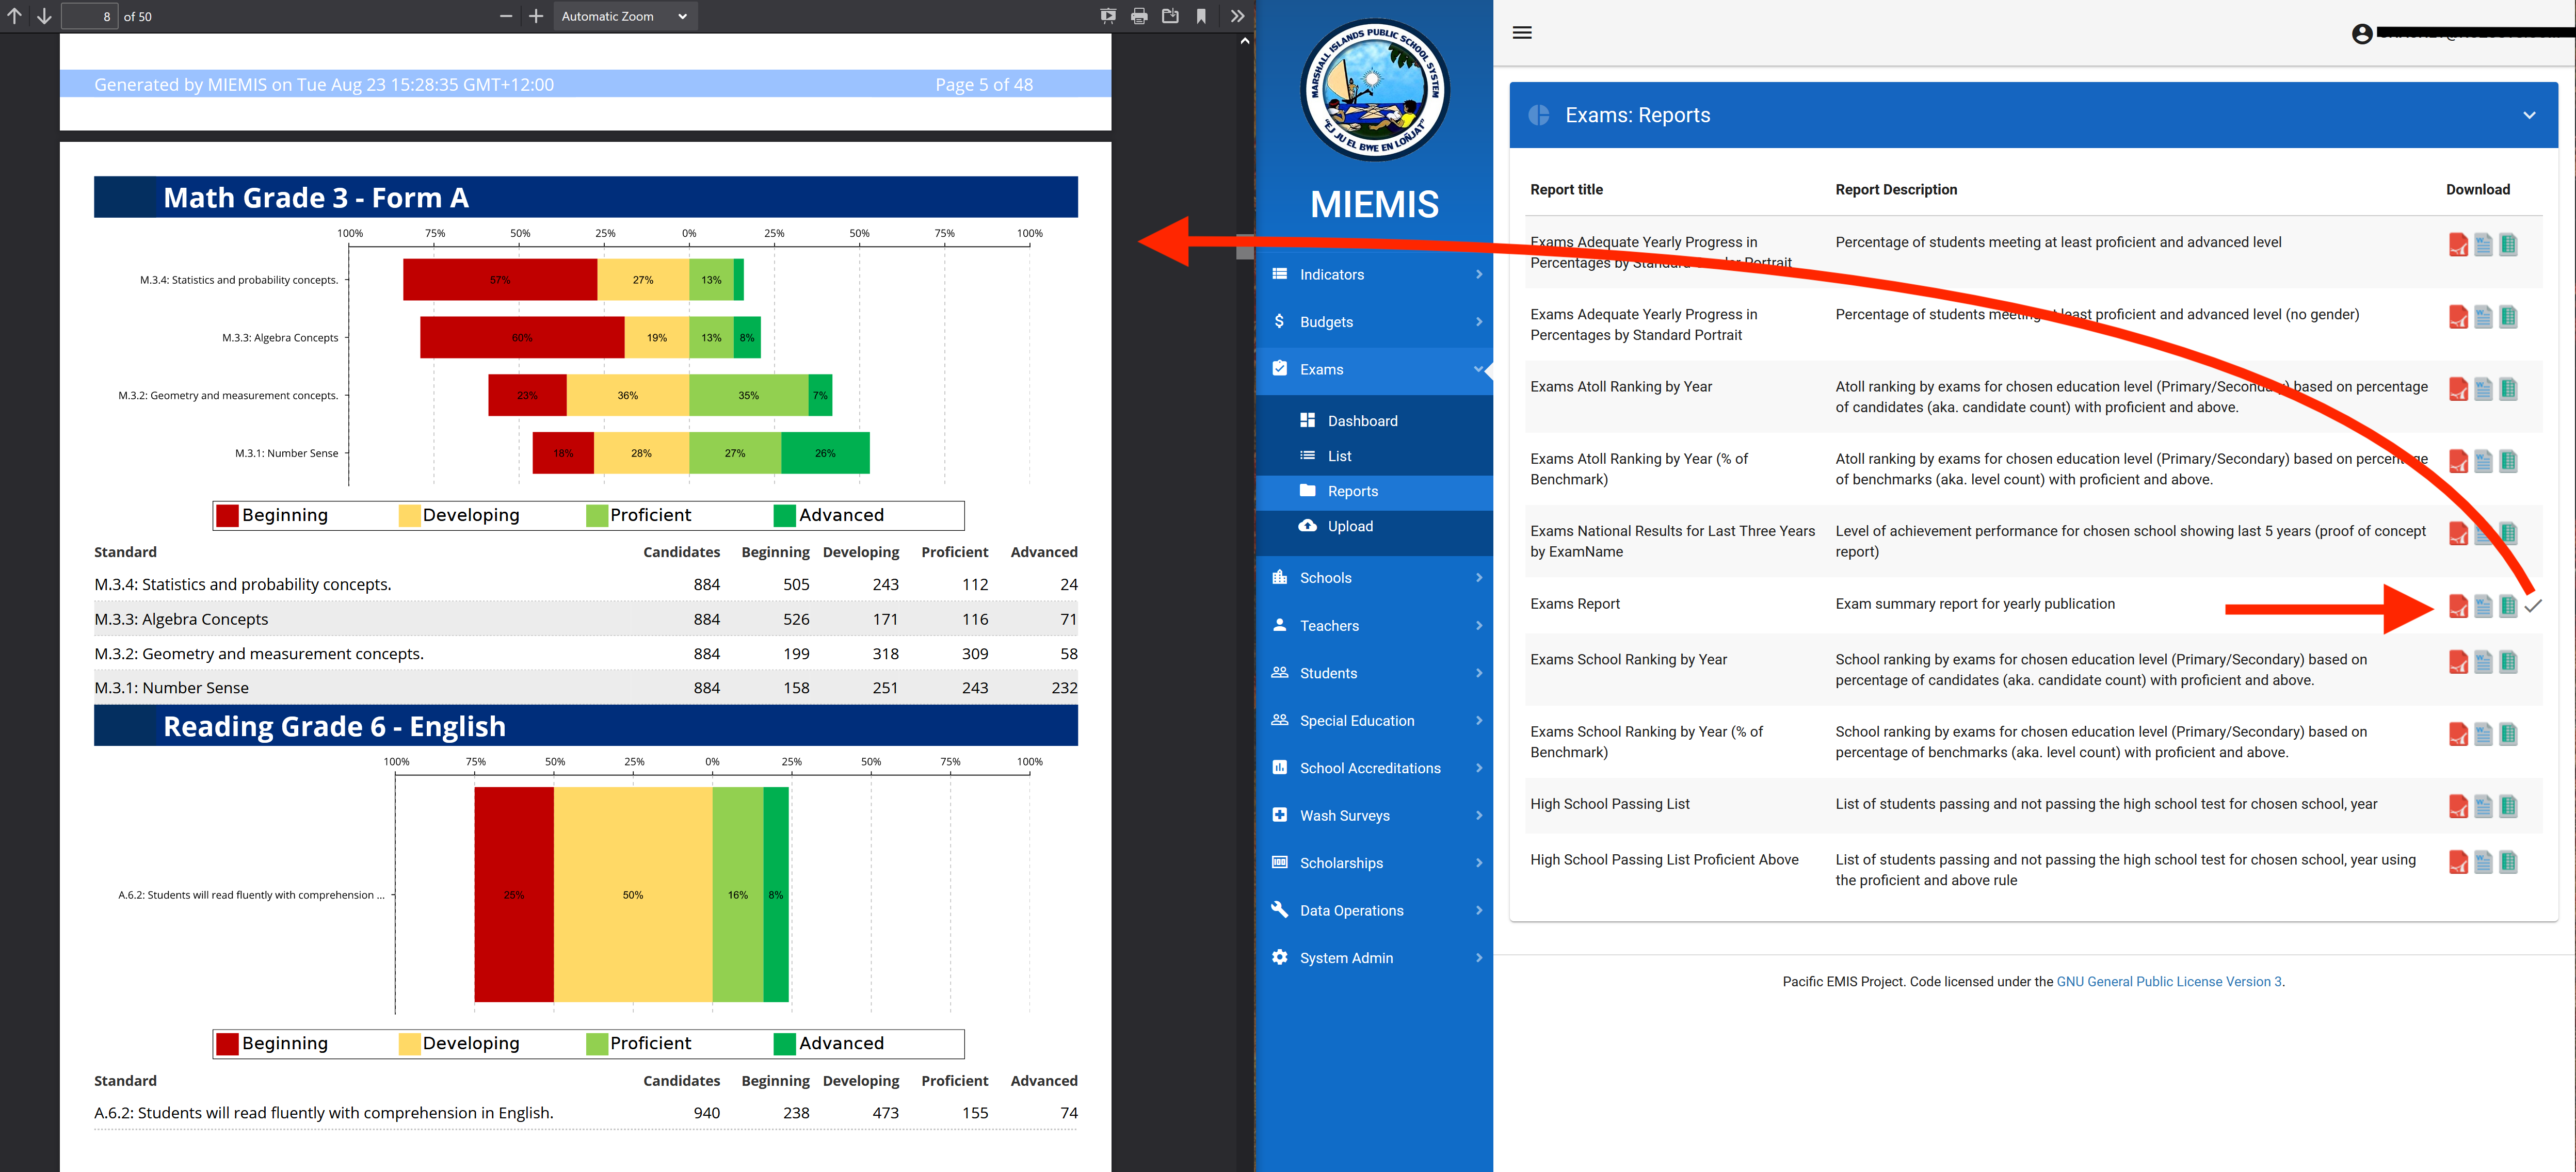
Reports
As always, professional hard copy reports are available for generation and download. You can find them at the usual Exams → Reports page.
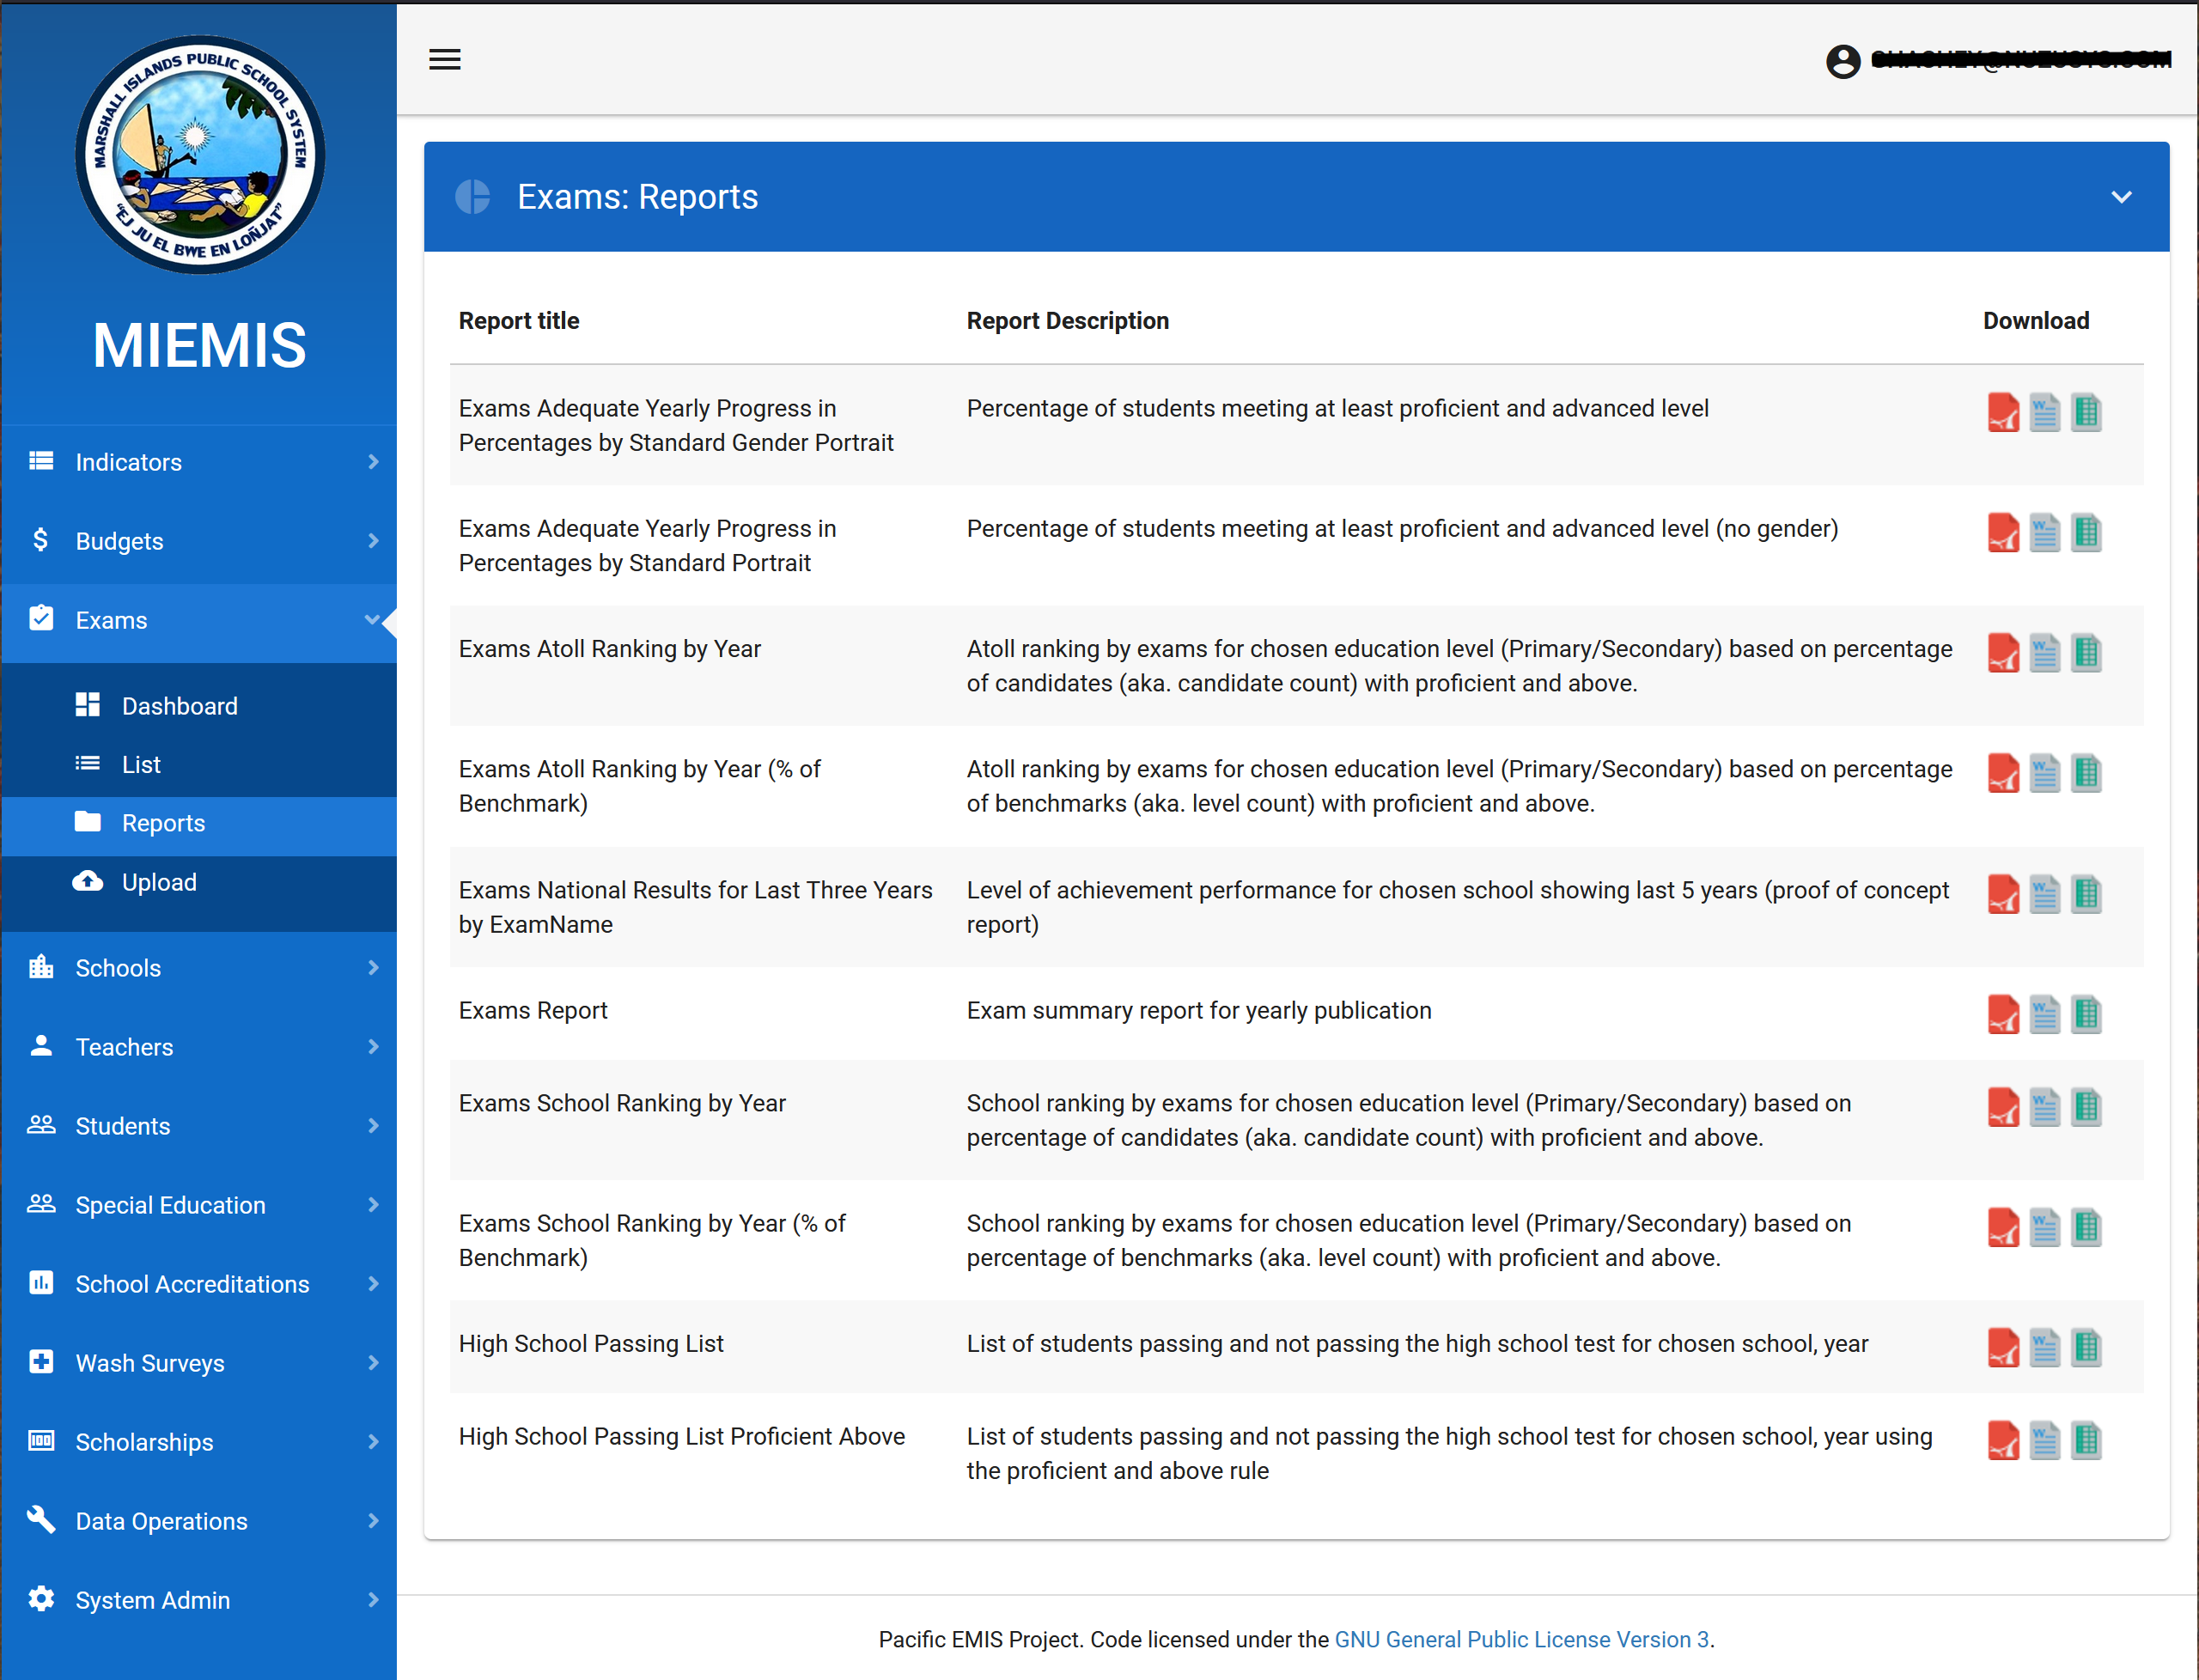
For example, click on the PDF icon to generate the following report.
For details on how the data is processed in the analysis of the results refer to EMIS Exams Module
Schools
Managing schools
A module to manage schools. It contains all the major functionality of a module (i.e. Dashboard, List, Map, Reports). Refer to Overview of Feature (Modules) for general information about using the Dashboards, managing your data and viewing reports.
Managing a single school
To manage a individual school you can choose a school from the list of schools and click on the school ID link to enter that school. You will see something like the following with a number of tabs for that particular schools. The default first tab is a comprehensive dashboard.

Managing basic information for the school is done in the School Info tab. You can click on edit as shown below to edit any of the fields.

If the form is ready to be saved with your new information you will be allowed to save.

If for some reason the data is not valid (e.g. missing the school name or some other required data) then it will be in red and will not allow saving.

Managing Documents
Under the tab Documents you can manage an archive of documents for the school. This could be school permits, building plans, photos, etc. You can add new documents by clicking on the + as shown below

You will see a dialog window where you can drop a file in.

And then also include some optional information about the file. See below for example.

Once you click on upload it will save the file to the system and you should see it appear in the background. You can can close the file dialog as shown below or load new files.

Once returned to the list of files you will see them all there. You can flip the thumbnail as you like, edit the file and remove it using the buttons as outlined below.

Editing the file will open the below where you can then Save, Undo your changes or change your mind and close the edit dialog window.

Deleting the file will ask you to confirm so the user does not do it by mistake.

Executing Reports
The Reports tab contains a list of reports with available exports as PDF, Word and Excel. But this time the reports are for the particular school for which you are viewing. An example of this is a School Accreditation report.

Some reports will prompt you for extra parameters as shown below. Some parameters are automatically filled using the EMIS context data (in this case the school ID is automatically added because the system is inside a particular school and it knows that). The year must be entered by the user in this case as reports can be often generate for this year or any year in the past for which there is data.

Clicking on “Run Report” above will generated the report dynamically and make the document available for download.

You can click on the downloaded report to view it in the browser.

The next tab is Survey which is actually an aggregate version of your annual census (i.e. the Data Collection Workbook). You can view them here online but the data is actually managed in the Annual School Census Workbook offline tool.

Various other tabs for individual schools
You can see a list of exams the school participated in in the Exams tab.

Finally, the School Accreditation tab shows the school accreditation status in details. If more then one accreditation inspection was done it will list them all with the latest at the top.

Teachers
The teacher module offers all the core functionalities such as visualizing teacher data through the interactive dashboard and maps, managing teacher data and generating reports. The following section will review some of the features particular to teachers not found elsewhere.
Lookup Configuration
Before some of the features of the Teachers module can be used it is necessary to configure it correctly. This is usually done through lookups. The relevant lookups for teachers are the following:
- Languages
- Nationalities
- Organizations
- Subjects
- Teacher Link Types
- Teacher Quals
- Teacher Roles
- Teacher Status Values
- Teacher Training Types
More on lookups at https://docs.pacific-emis.org/doku.php?id=emis_user_manual#lookups
Managing teacher data
The teacher related data can be managed in the Teacher → List which will display all the teachers in the system. Click on any of the teacher to enter its profile and manage his/her data.

In the Teacher Info tab you can manage general data about that teacher and see who last updated the teacher. This is done as usual by click on the Edit link (pencil at top right of panel).

Viewing in what school teacher is at
If you go to the Surveys (Workbook) you can see all the recorded places the teacher was teaching over the years. There is an important distinction to note in the following. On the left under Survey (Workbook) you see where the teacher is reported to have been teaching in the annual school census. While on the right under Appointment you see where that teacher was assigned or appointed using the teacher planning tool. This feature is currently not in use much as therefore you will see mostly the data under Survey (Workbook).

Managing teacher qualifications
One of the most important feature of the system is the ability to manage teacher qualifications in a flexible way. This is under the Qualifications tab. In Qualifications you can actually manage all the following
- Teacher qualifications such as academic degrees (e.g. Bachelor of Education, Masters of Science)
- Teacher certification (e.g. in country testing and certification process of teaching typically on curriculum, teaching leadership and other important concepts for teacher)
- Teacher trainings (e.g. specialized workshops)
You can view existing ones and add new ones by clicking on the + button as shown below.

The first step is to enter the year of the qualification and select the actual qualifications from the dropdown field. Since this is a flexible framework for managing qualifications depending on the chosen qualification it will decide what data you enter after.

Choosing an Associate of Arts will present the user with the following data to submit. Enter the data and click on Save when done.

The system will prompt the user to indicate whether or not a new qualification for that teacher should be enter. Click No if done.

You should return to the list of qualification seeing your newly added qualifications. You can record as many if you need for the teacher. You can then either edit old records or delete records if they were added by mistake.

Clickin the the edit pencial will open the dialog that can either be closed back again or click Edit to continue with the editing of the qualification.

If you click edit you can change the data and finally click on Save to save your changes.

On the other hand, if you wanted to delete a qualification you click on the delete trash icon and you will be asked to confirm as shown below.

Managing documents, teacher portraits in particular
Managing documents is done exactly like described for schools in Managing Documents. One important difference with teacher documents is the ability to add teacher portraits to the system which will then be used in the teacher profile reports, etc. You add a teacher portrait exactly like you would add another document as shown below.

The one important difference is that the Category of the document added is Portrait as shown below. Clicking upload will then load the profile picture of the teacher in the documents archived and will be available to include in teacher profile reports, etc.


Managing duplicate teacher data
Due to the nature of how data is managed in the challenging environment of small Pacific Island countries (i.e. remote disparate and off line communities) duplicate data inevitably creeps into the system. The system can intelligently handle duplicate data without affecting the total numbers reported on a year-by-year basis. However, something teachers are entered with a slightly different spelling of name or different birth date. When this happens the history of the same teacher is broken down. You can clearly see examples of duplicate teachers records as shown in the list below.

Ideally, the duplicates are constantly cleaned up. Since this is a Data Operations feature it can be found under the menu item Data Operations → Deduplicate Teachers. How this works in documented in the Deduplicate Teachers
Students
The EMIS typically would record student data as aggregates which can provide the necessary data for education key indicators and decision making. However, some may wish to record individual students and all their enrolments and more. The Pacific EMIS now supports this through loading of a annual school census workbook. The individual student records can then be accessed online as shown below.

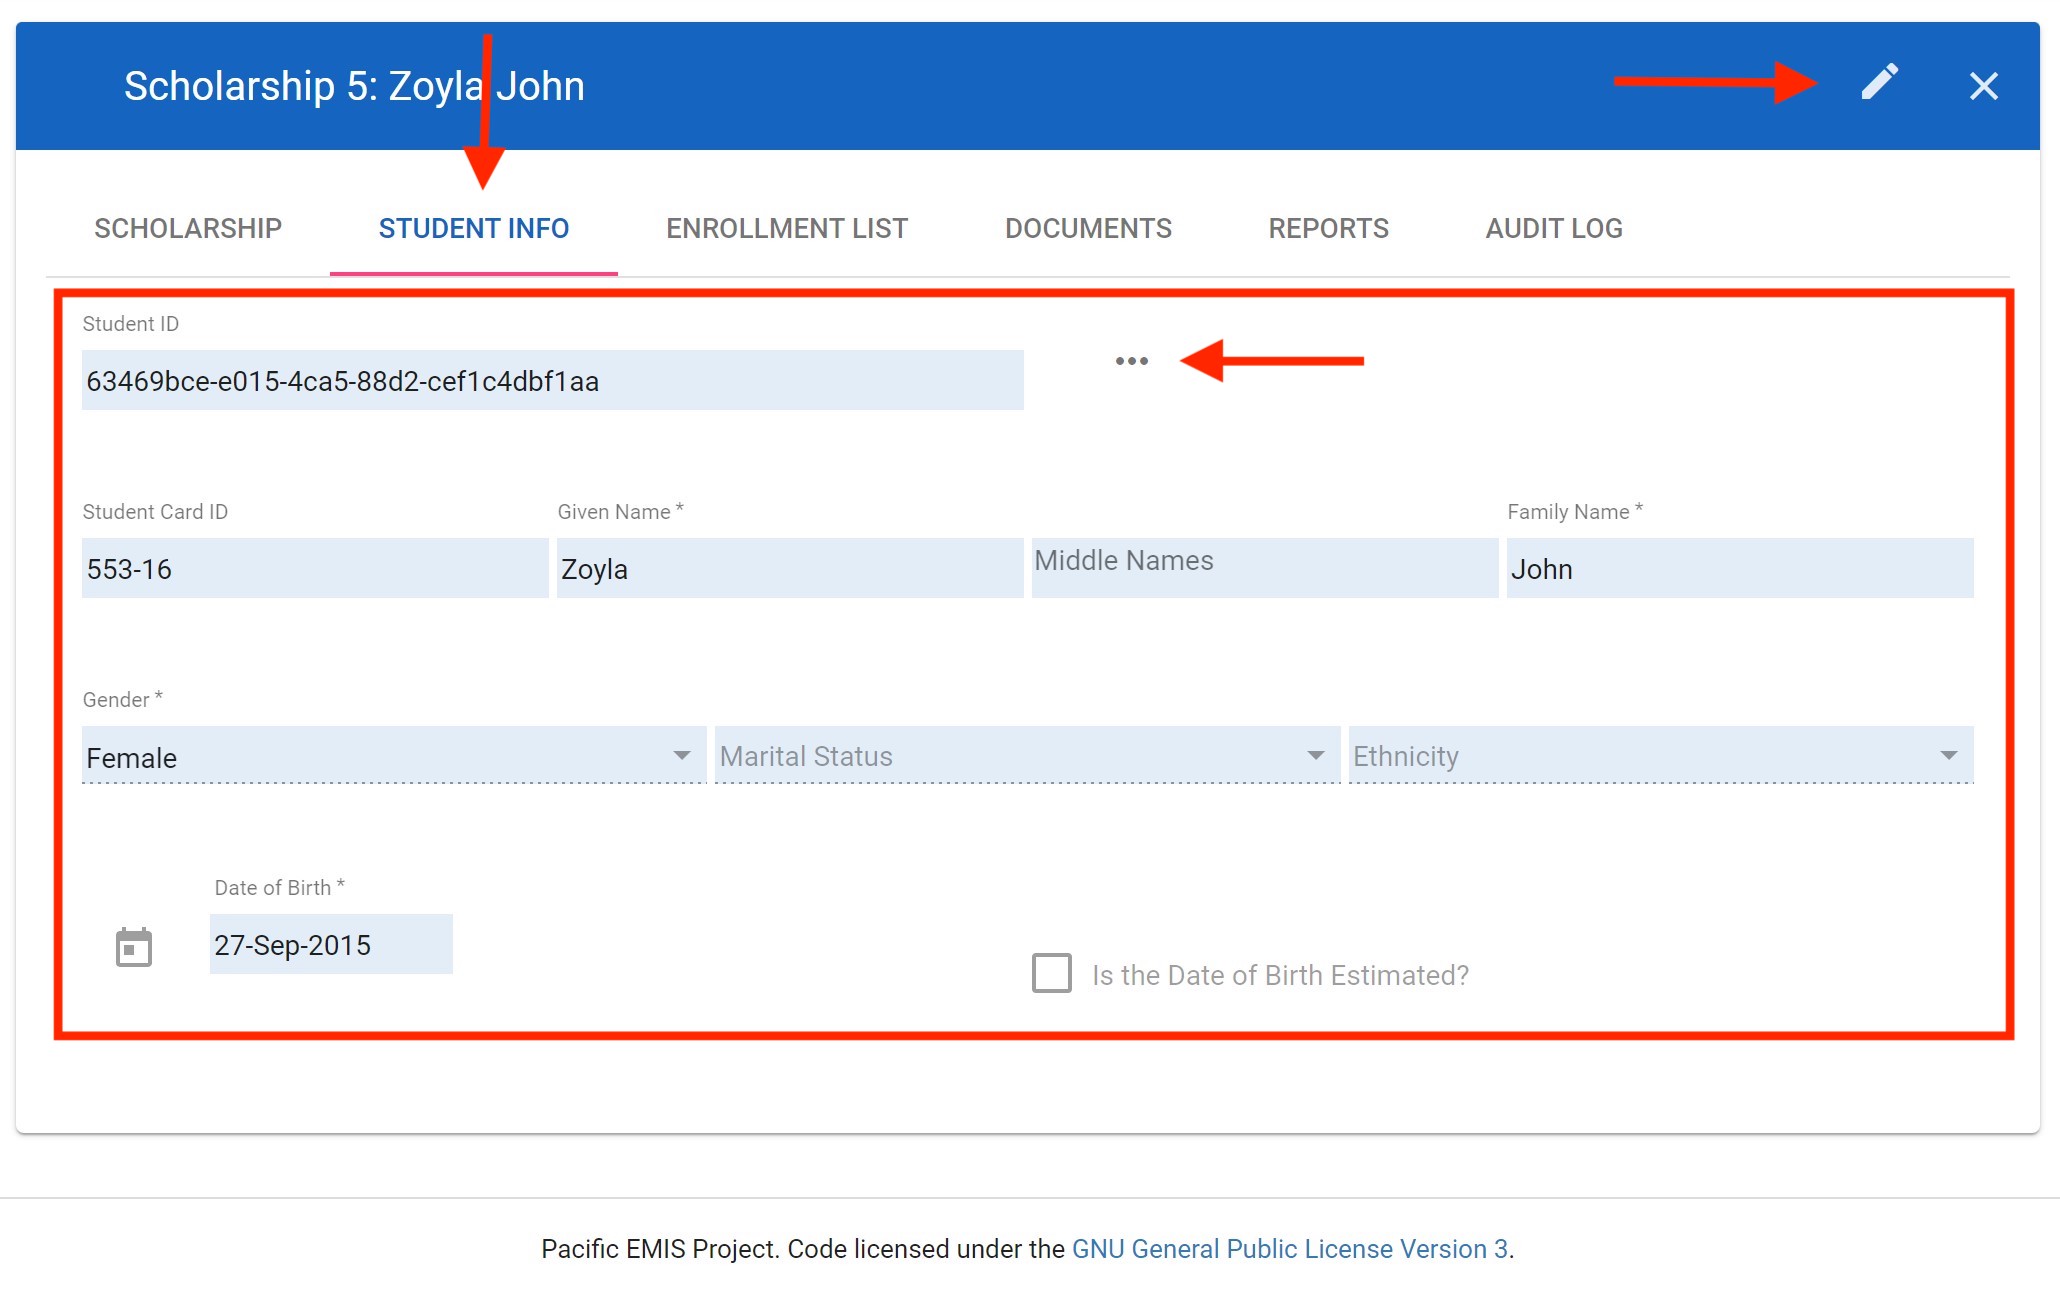
Access an individual students just like any other entity by clicking on its ID. You will see the student profile as shown below. The first tab is general student information.

You can edit the data as shown below.

You can see a list of enrolment for that students.

Special Education
The special education module is mostly based on the Individuals with Disabilities Education Act and data submission requirements of the United States' EdFact. If you have it enabled you can access it from the main menu Special Education. There is the typical module sub menu items:
- Dashboard where you can access dynamic data analysis
- List where you can access all the special education data
- Reports where you can include some Jasper PDF reports though none are yet available

Loading Special Education Data
There are two methods to load special education data.
Load the data through the annual school census workbook
The latest version has some additional fields for special education student. You do this exactly like you do when submitting data through the Annual School Census Workbook but complete the data in the following fields for all the special education data. Care must be taken to make use of the drop down values and not enter free text in the cells. If you need different data report this to your support staff and it could be added.

Edit the sped student record directly from the web UI
The other way is to go edit directly in the web UI. Getting to your data is done the usual way. Go in the Special Education → List. You can search using the filter. In the example below I get all special education student for the Kosrae High Schools.

Then click on the student ID to enter the student account. There you can click on Edit as usual and edit the student data.

You can browse other tabs. For example, the Special Education tab holds data specific to special education students.

The Enrolment tab holds a history of the students enrolments as recorded over the years through the workbook.

The Reports tab will hold individual PDF reports for this particular student.
School Accreditations
The School Accreditation module works with the Education Survey Tool Android app. The workflow works like this. The data is all entered through the tablet app which has Form B preview capabilities and more, the school accreditation can then be loaded from the cloud to the EMIS by a person with authority (e.g. Directors), the data is then in the EMIS where the user can view the data, access data analytics dashboard, print out reports and hard copies of the Form B report by schools.
Each feature will be better explained in the following sections.
Education Survey Tool for Data Entry
Loading School Accreditation Inspections from the Cloud
The data is collected on the Education Survey Tool, sometimes offline in remote locations, and when the tablet returns to the main office with the Internet it syncs all its data to the cloud. From there we can view it in the EMIS and manipulate it in a number of ways (e.g. download it, delete it, approve it for loading into the EMIS).
You can access all the synced school accreditations from the main menu School Accreditation → Cloudfiles as shown below. If some files have sync and are ready (completed fully) then you will see them as shown below.

As usual you can use the filter to narrow down your search of files. Most filters are familiar except a new one specific to cloudfiles: Status. The status can be any of the following:
- Ready: When a school accreditation is complete and ready to be approved and loaded into the EMIS database
- In Progress: When a school accreditation is in progress (i.e. there is some data not it is not complete)
- Active (Ready / In Progress): When active it means all the Ready and In Progress combined are showing
- Merged: The tablets support merging together data offline. The process is typically worker tables merge into a team leader's tablet. The worker tablets then become merged and the team leader's tablet become Ready if complete.
- Loaded: When a school accreditation in Ready status is loaded into the EMIS is becomes Loaded.

Click on one of the Ready school accreditation to open it. You should see something like below. The first red rectangle shown the current state of the cloud file. The second one is a list of action buttons:
- Download: Mainly for technical people who would like to download the raw data in the format XML
- Delete: Use to delete unwanted cloud files. The user might have submitted two identical copies by mistake or just some routine cleanup when you have loaded the file and eventually no longer need it in the cloud
- Approve: For a person with authority to approve the school accreditation. Only upon approval will a cloud file be downloaded and loaded into the system.
The third red rectangle are tabs to navigate the school accreditation.
- FORM B: This is the full Form B report result of that school accreditation
- Survey: This is all the raw data collected on the tablet app
- Photos: These are all the photos collected for any of the sub-criteria

Only the Approve will be shown here. The other ones are self explanatory. Clicking on Approve will prompt the user to confirm as shown below.

Once successfully loaded into the EMIS the user will return to the same place but the status will changed to Loaded: ID when ID is the unique identifier of the newly loaded school accreditation.

School Accreditation Loaded Data
Once loaded into the system it will remain perpetually and be available in analysis, reports, etc. You can access it from in School Accreditation → List as usual. In the case below the newly added school accreditation was for the school Lukop Elementary School and was located using the filter school name. You can click on the record ID to access it.

You will then open a read only version of the school accreditation record. Any editing can only be done through the tablet app though typically once approved the school accreditation becomes final.

The school profile also hold their latest school accreditation as shown below.

It also archives the photos taken with the description set to the sub-criteria it was taken under as shown below.

And finally, the report is available in the hard copy PDF, Word or Excel format in the Reports section as shown below.

School Accreditation Dashboard
This is where you can get some live data analytics just like every other module in the EMIS. You access just like other dashboard, Click on School Accreditation → Dashboard.

If you click on the magnifying glass you have your typical filter to dynamically adjust the whole dashboard. For example, you can filter by year, district (e.g. State, Atoll, Province), authority type (e.g. Government, Non-government), authority and school type. This is shown below.

Sometimes the dashboard components have their own filter. For example, the following dashboard component has a filter in red rectangle which says the data shown in cumulative to 2019 (or whatever year is selected in the filter).

And when switching that local filter to Evaluated in 2019 then you see the data is adjusted to only show for school accreditation done in 2019. In the following case there was just a single school accreditation done in Chuuk though this was a test one.

Further down you have a nice tablet that display Accreditation Status by State. It has data for both “Evaluated in year” and “Cumulative up to year”. You can also drilldown further into the data. For example, click on any number as shown below with the arrow.

You will see a pop-up window that will contain more detailed data in the schools where made up the number you clicked in the previous step.

Further down still, you have a table of Performance by Standard nation wide (though you could filter by state in the filters at the top). The same drill down to get more detailed information is also possible here. For example, if you click on the number 7 as shown by the arrow in following illustration you will drill down those 7 schools.

You get a pop up window showing those 7 schools with more detailed information. For example, in this case we click the 7 schools that achieved a level 4 cumulatively up to 2019. We see the below which not only shows the 7 schools but also a further break down into the level 4 Leadership criteria as shown below.

School Accreditation Reports
WASH Surveys
The WASH Surveys module works with the Education Survey Tool Android app since it is a type of school inspection done through a survey. The workflow works like this. The data is all entered through the tablet app, the WASH surveys can then be loaded from the cloud to the EMIS by a person with authority (e.g. Directors), the data is then in the EMIS where the user can view the data, access data analytics dashboard, print out reports and access the data from the warehouse for further flexible analysis.
Each feature will be better explained in the following sections.
WASH Survey Data Entry
As mentioned, the data entry for WASH surveys are done using the Education Survey Tool Android app. Open the Education Survey Tool and click on Water, Sanitation and Hygiene as shown below.

You will see a list of any previously completed WASH survey on that tablet if any. Click on the + to create a new one.

You will then have to choose which school and you can optionally edit the survey date as shown below in red rectangles. Then click on Choose to create the new survey for that school.

Fill up the survey questions all one by one carefully. Don't forget to save individual questions when you see the small checkmark icon as shown below in second question. Follow your progress looking at the progress bar as shown below in red rectangle at the top right. Finally click next when all questions in the section are completed.

Once completed all your progress bars should look like follows.

Then you can click on Complete as shown below.

You will then see your newly added school WASH survey. The one just added below as example was MAJ106 - Delap Kindergarten - 2020-04-15.

Loading WASH Surveys from the Cloud
The data is collected on the Education Survey Tool app, sometimes offline in remote locations, and when the tablet returns to the main office with the Internet it syncs all its data to the cloud. From there we can view it in the EMIS and manipulate it in a number of ways (e.g. download it, delete it, approve it for loading into the EMIS).
You can access all the synced WASH Surveys from the main menu WASH Surveys → Cloudfiles as shown below. If some files have synced and are ready (i.e. completed fully) then you will see them as shown below.

As usual you can use the filter to narrow down your search of files. Most filters are familiar except a new one specific to cloudfiles: Status. The status can be any of the following:
- Ready: When a WASH survey is complete and ready to be approved and loaded into the EMIS database
- In Progress: When a WASH Survey is in progress (i.e. there is some data not it is not complete)
- Active (Ready / In Progress): When active it means all the Ready and In Progress combined are showing
- Merged: The tablets support merging together data offline. The process is typically worker tables merge into a team leader's tablet. The worker tablets then become merged and the team leader's tablet become Ready if complete.
- Loaded: When a WASH Survey in Ready status is loaded into the EMIS is becomes Loaded.
For example, below we are showing the cloud files “In Progress”.

And below we are listed the ones that are “Loaded” already in the system. Now to load new ones, you change the Status to “Ready” and click on the school ID as shown below with red arrow.

This will open the cloudfile and display it to you as shown below.

You can browse the whole survey by clicking on the tabs to view the data that was completed on the ground by the inspector with the tablet.

You can also use the dropdown select to access all the sub-group questions of the survey as shown below.
Once you have gone through the whole survey have the following actions at your disposal. The top left red rectangle shows the current state of the cloud file. The top right rectangle is a list of action buttons:
- Download: Mainly for technical people who would like to download the raw data in the format XML
- Delete: Use to delete unwanted cloud files. The user might have submitted two identical copies by mistake or just some routine cleanup when you have loaded the file and eventually no longer need it in the cloud (though there is no arm in keeping the valid cloud files in the cloud.
- Approve: For a person with authority to approve the WASH Survey. Only upon approval will a cloud file be downloaded and loaded into the system.
Most of the time, you will be “Approving” surveys by clicking on Approve.

You will then be asked to confirm as shown below.

The file approval process will start as shown below.

You will then be notified when the file approval is completed as shown below. At this point the cloud file has also been loaded into the EMIS for permanent archival, further analysis and reporting.

After clicking Close above you will be returned to the same cloud file but notice the state will now be Loaded (top left red rectangle below). You still have the same buttons with the exception that the “Approve” buttons has now be replaced with Reload (top right red rectangle below). You could reload the whole survey in the EMIS. For example, this could be useful if it was found out that there were mistakes in the survey or disputed results. You would need to change it in the tablet and reload it here to have the new data in the system. This should be fairly uncommon.
Finally, when done you can click on the x when done to close the cloud file.

You should be returned to the cloud files list. Notice that in the Status: Loaded files now you have the above newly loaded cloud file. It's the one for School ALU101 with status LOADED: 8526.

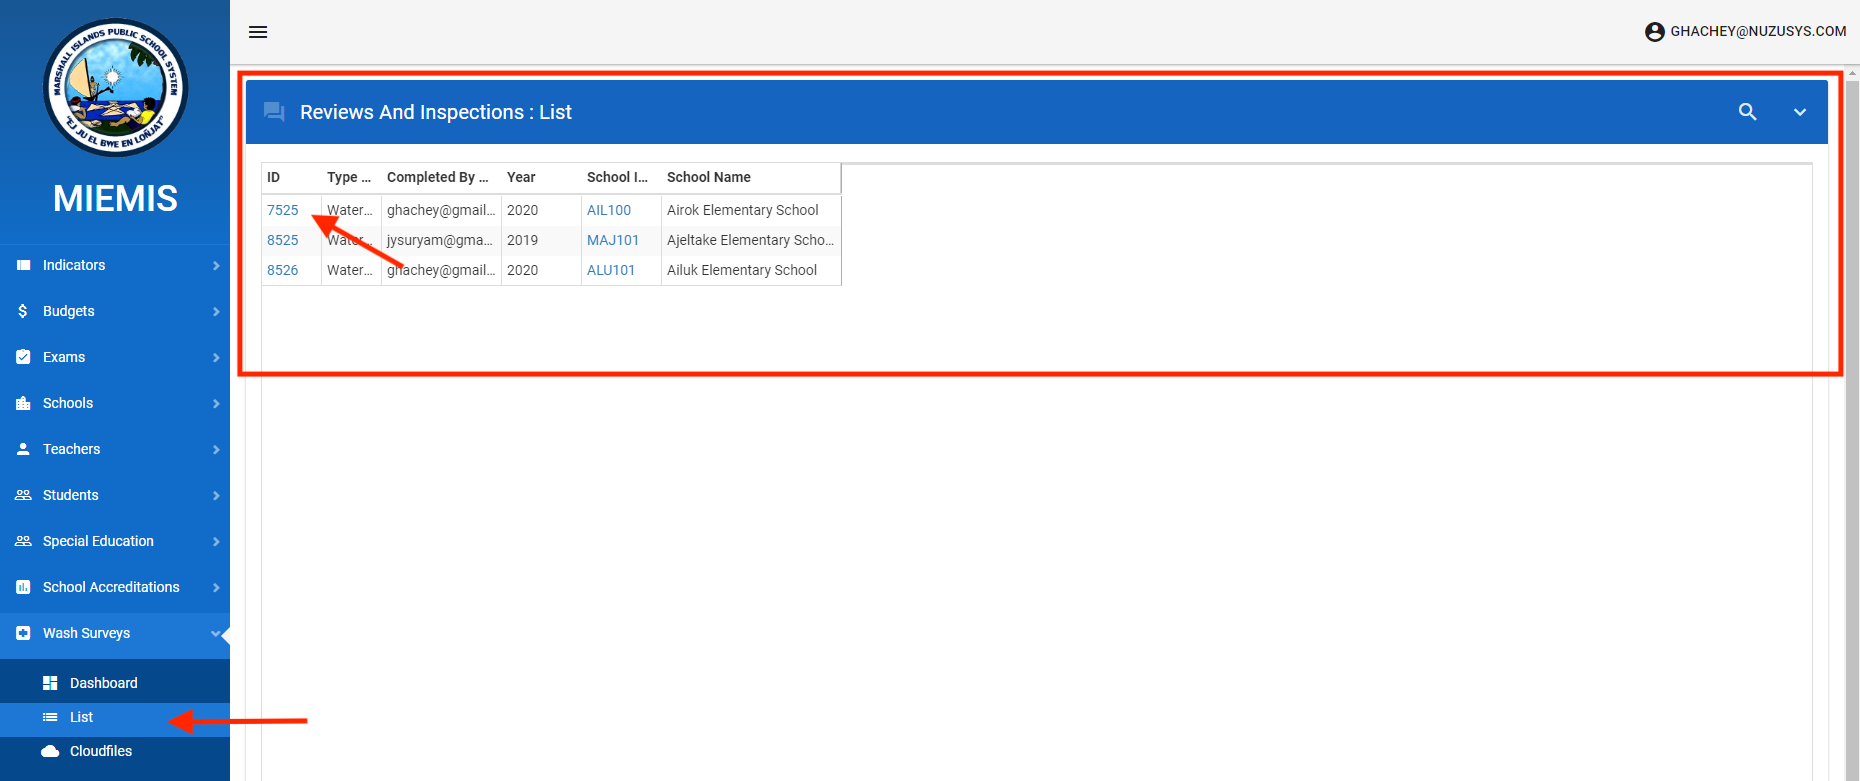
WASH Surveys Loaded Data
Once loaded into the system it will remain perpetually and be available in analysis, reports, etc. You can access it from in Wash Survey → List as usual. In the case below the newly added WASH survey was for the School ID: ALU101, School Name: Ailuk Elementary School. You can click on any of the ID as shown by the arrow below.
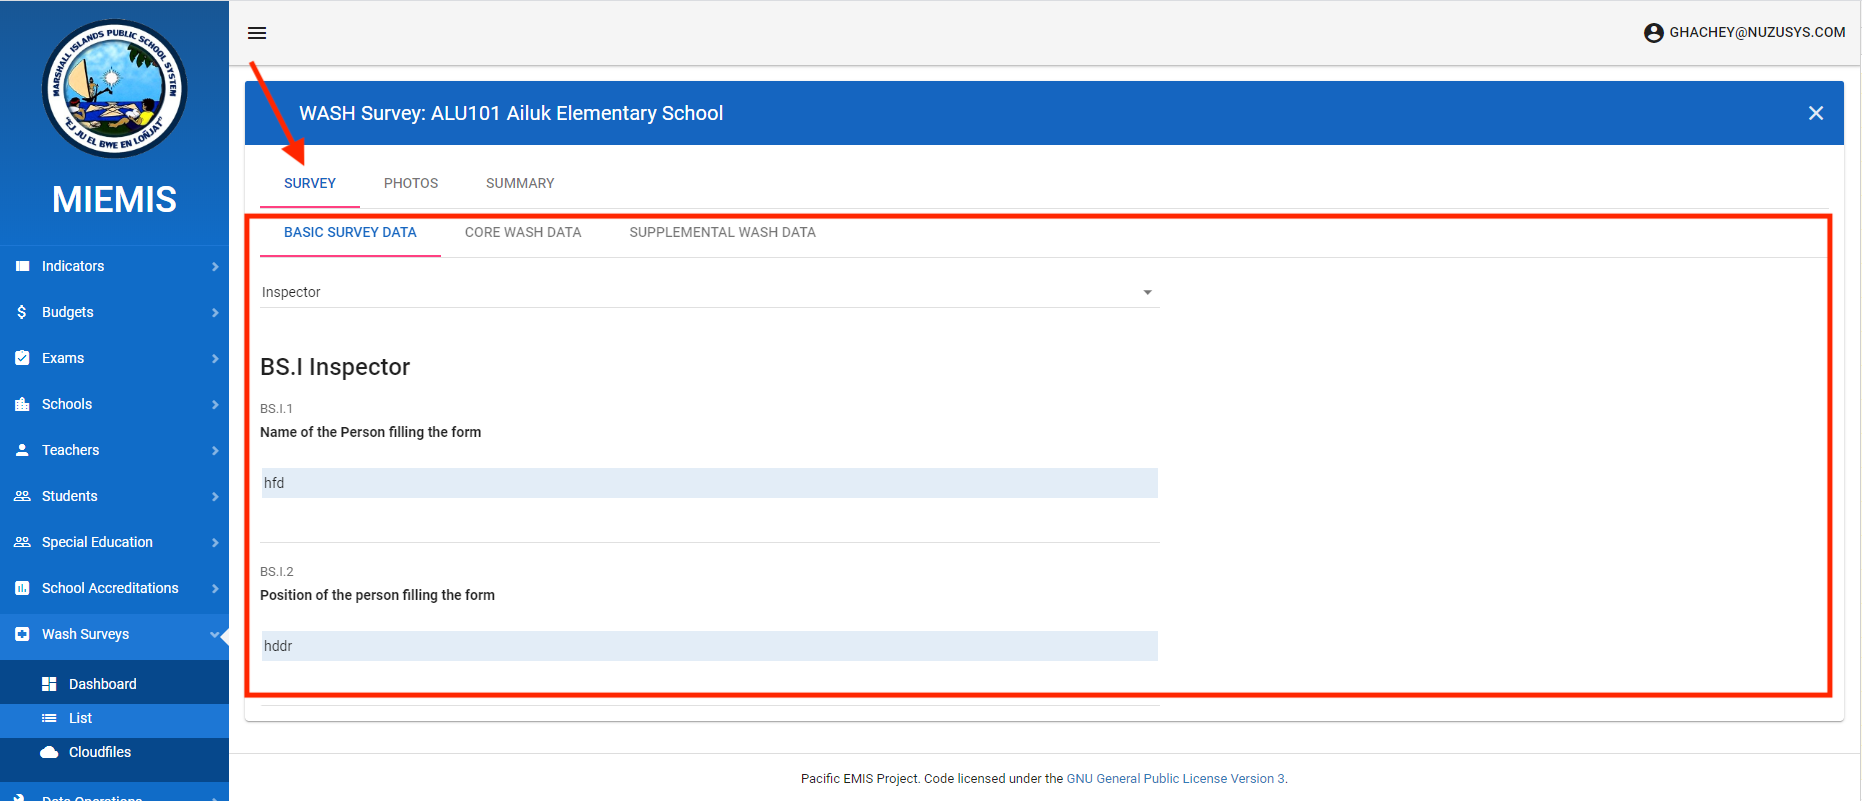
You will then open a read only version of the WASH Survey record. Any editing can only be done through the tablet app though typically once approved the school accreditation becomes final. This is different from opening a cloud file. This is opening the actual permanent data record from the database.
The below under the default Survey tab provides a view of the loaded survey.
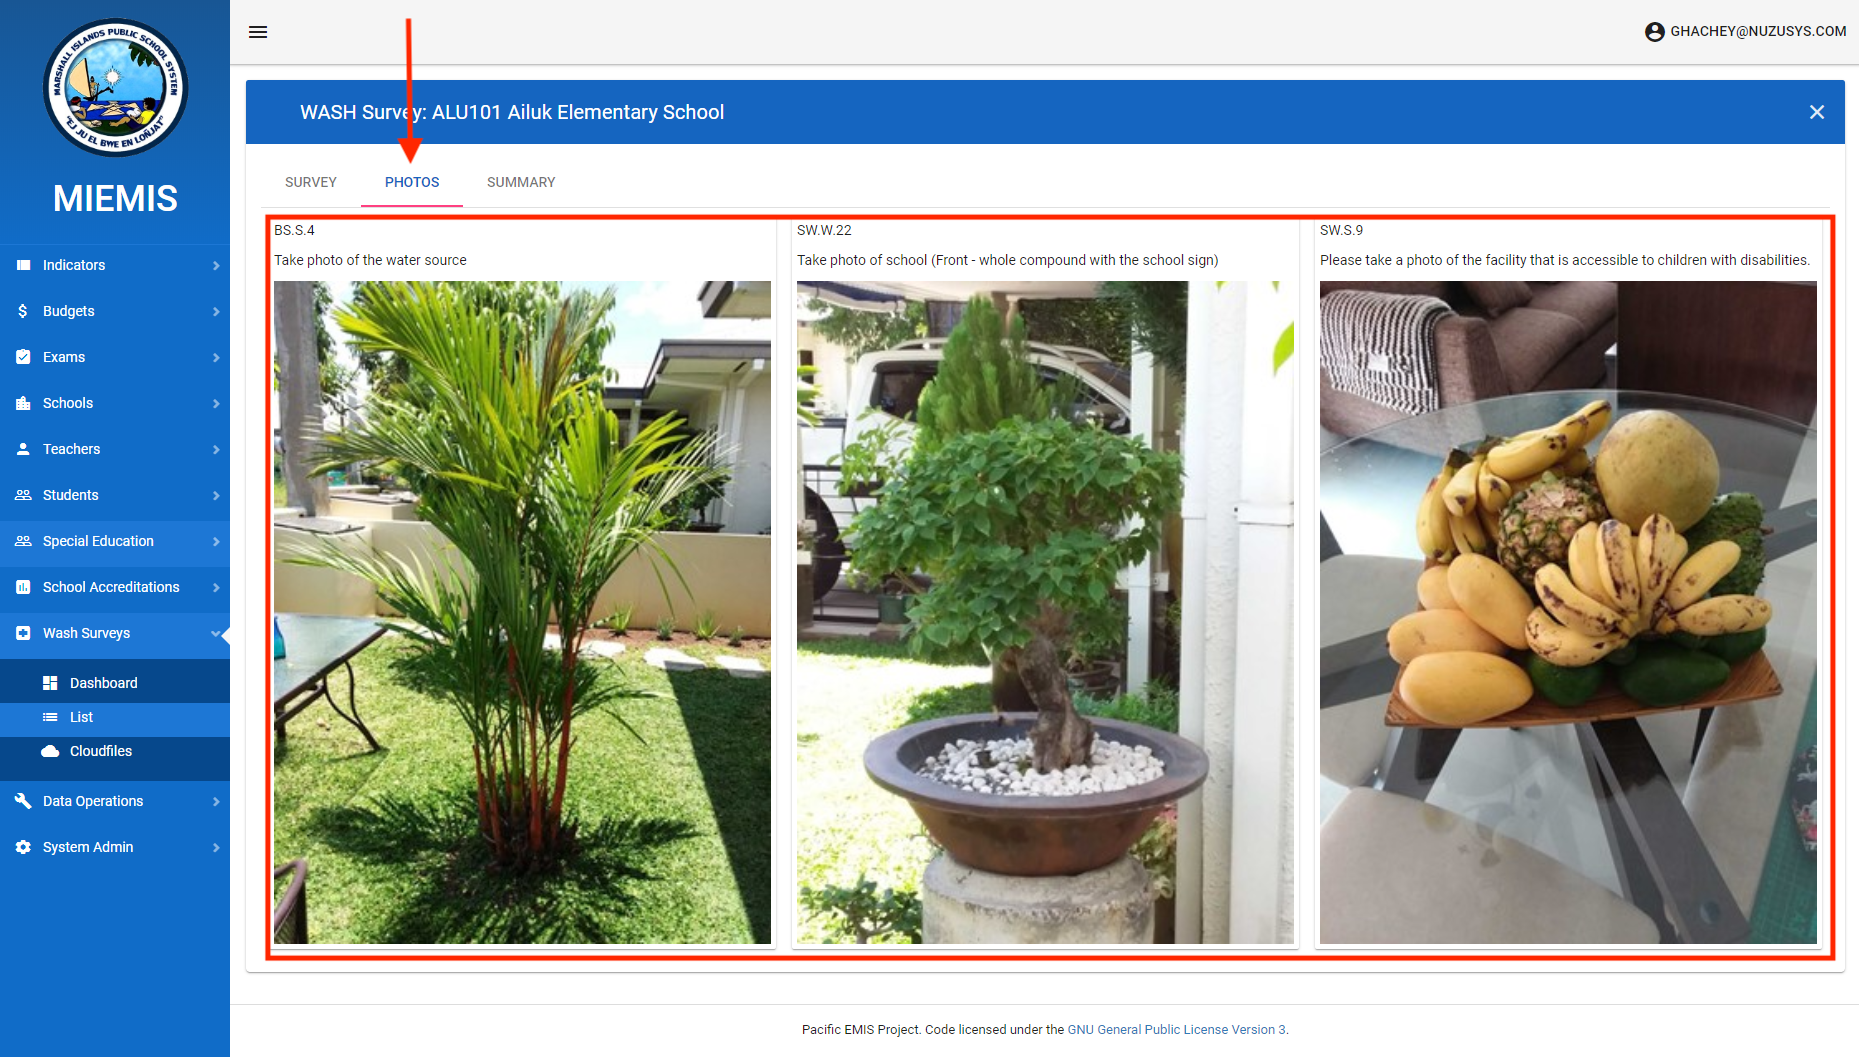
Under the Photos tab you can view all the photos taken for that WASH survey inspection.
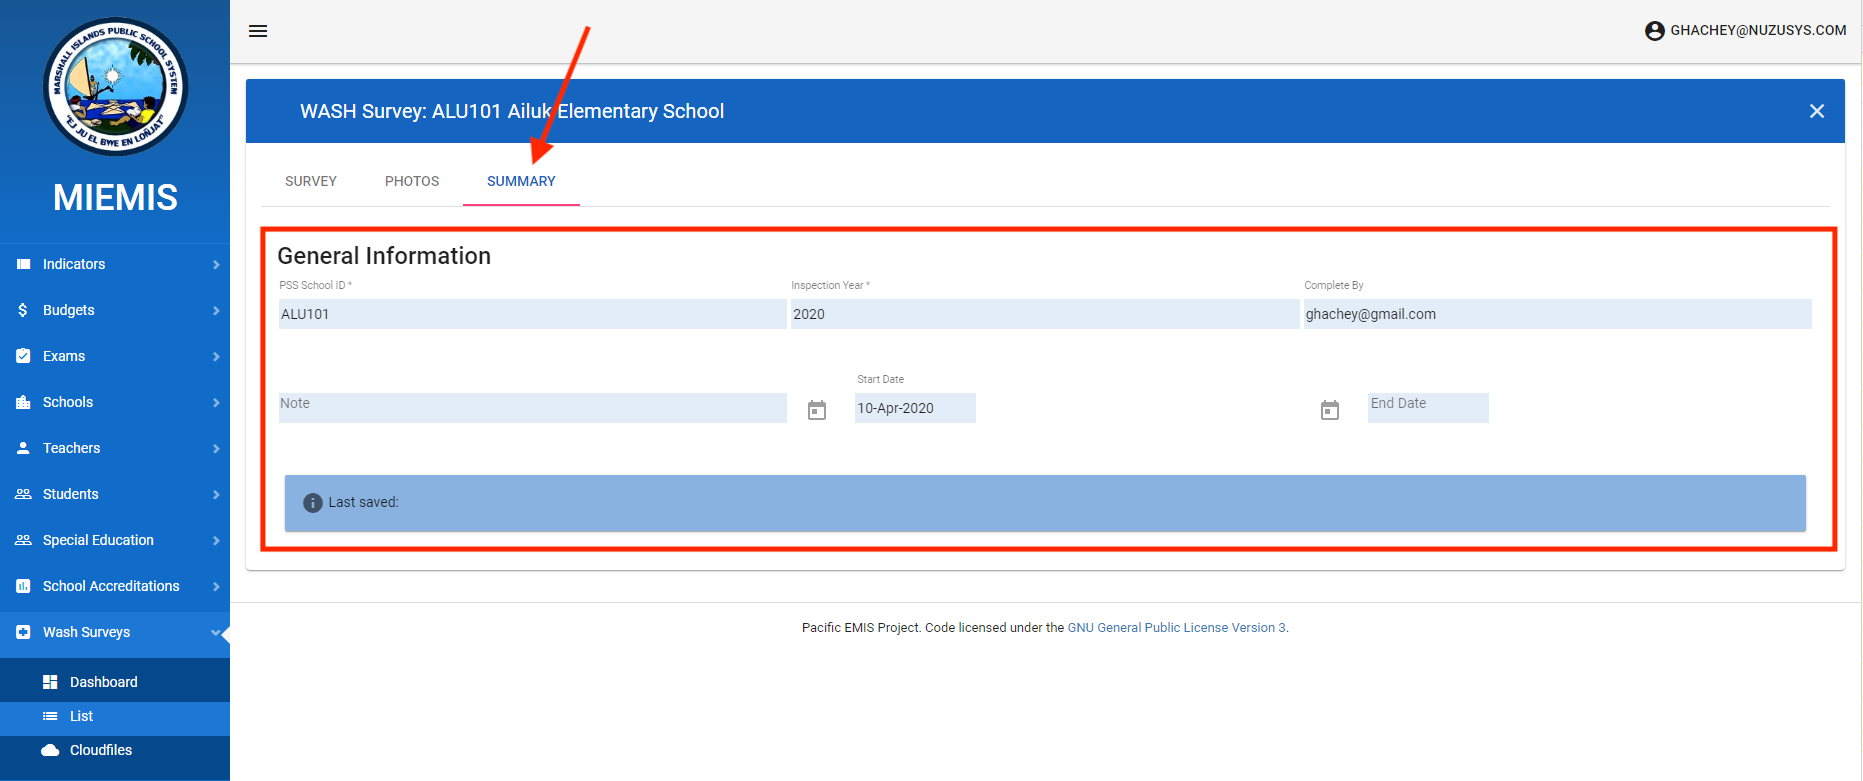
Under the Summary tab you will find basic data about the survey such as audit trail data (i.e. dates, who was the inspector)
WASH Surveys Dashboard
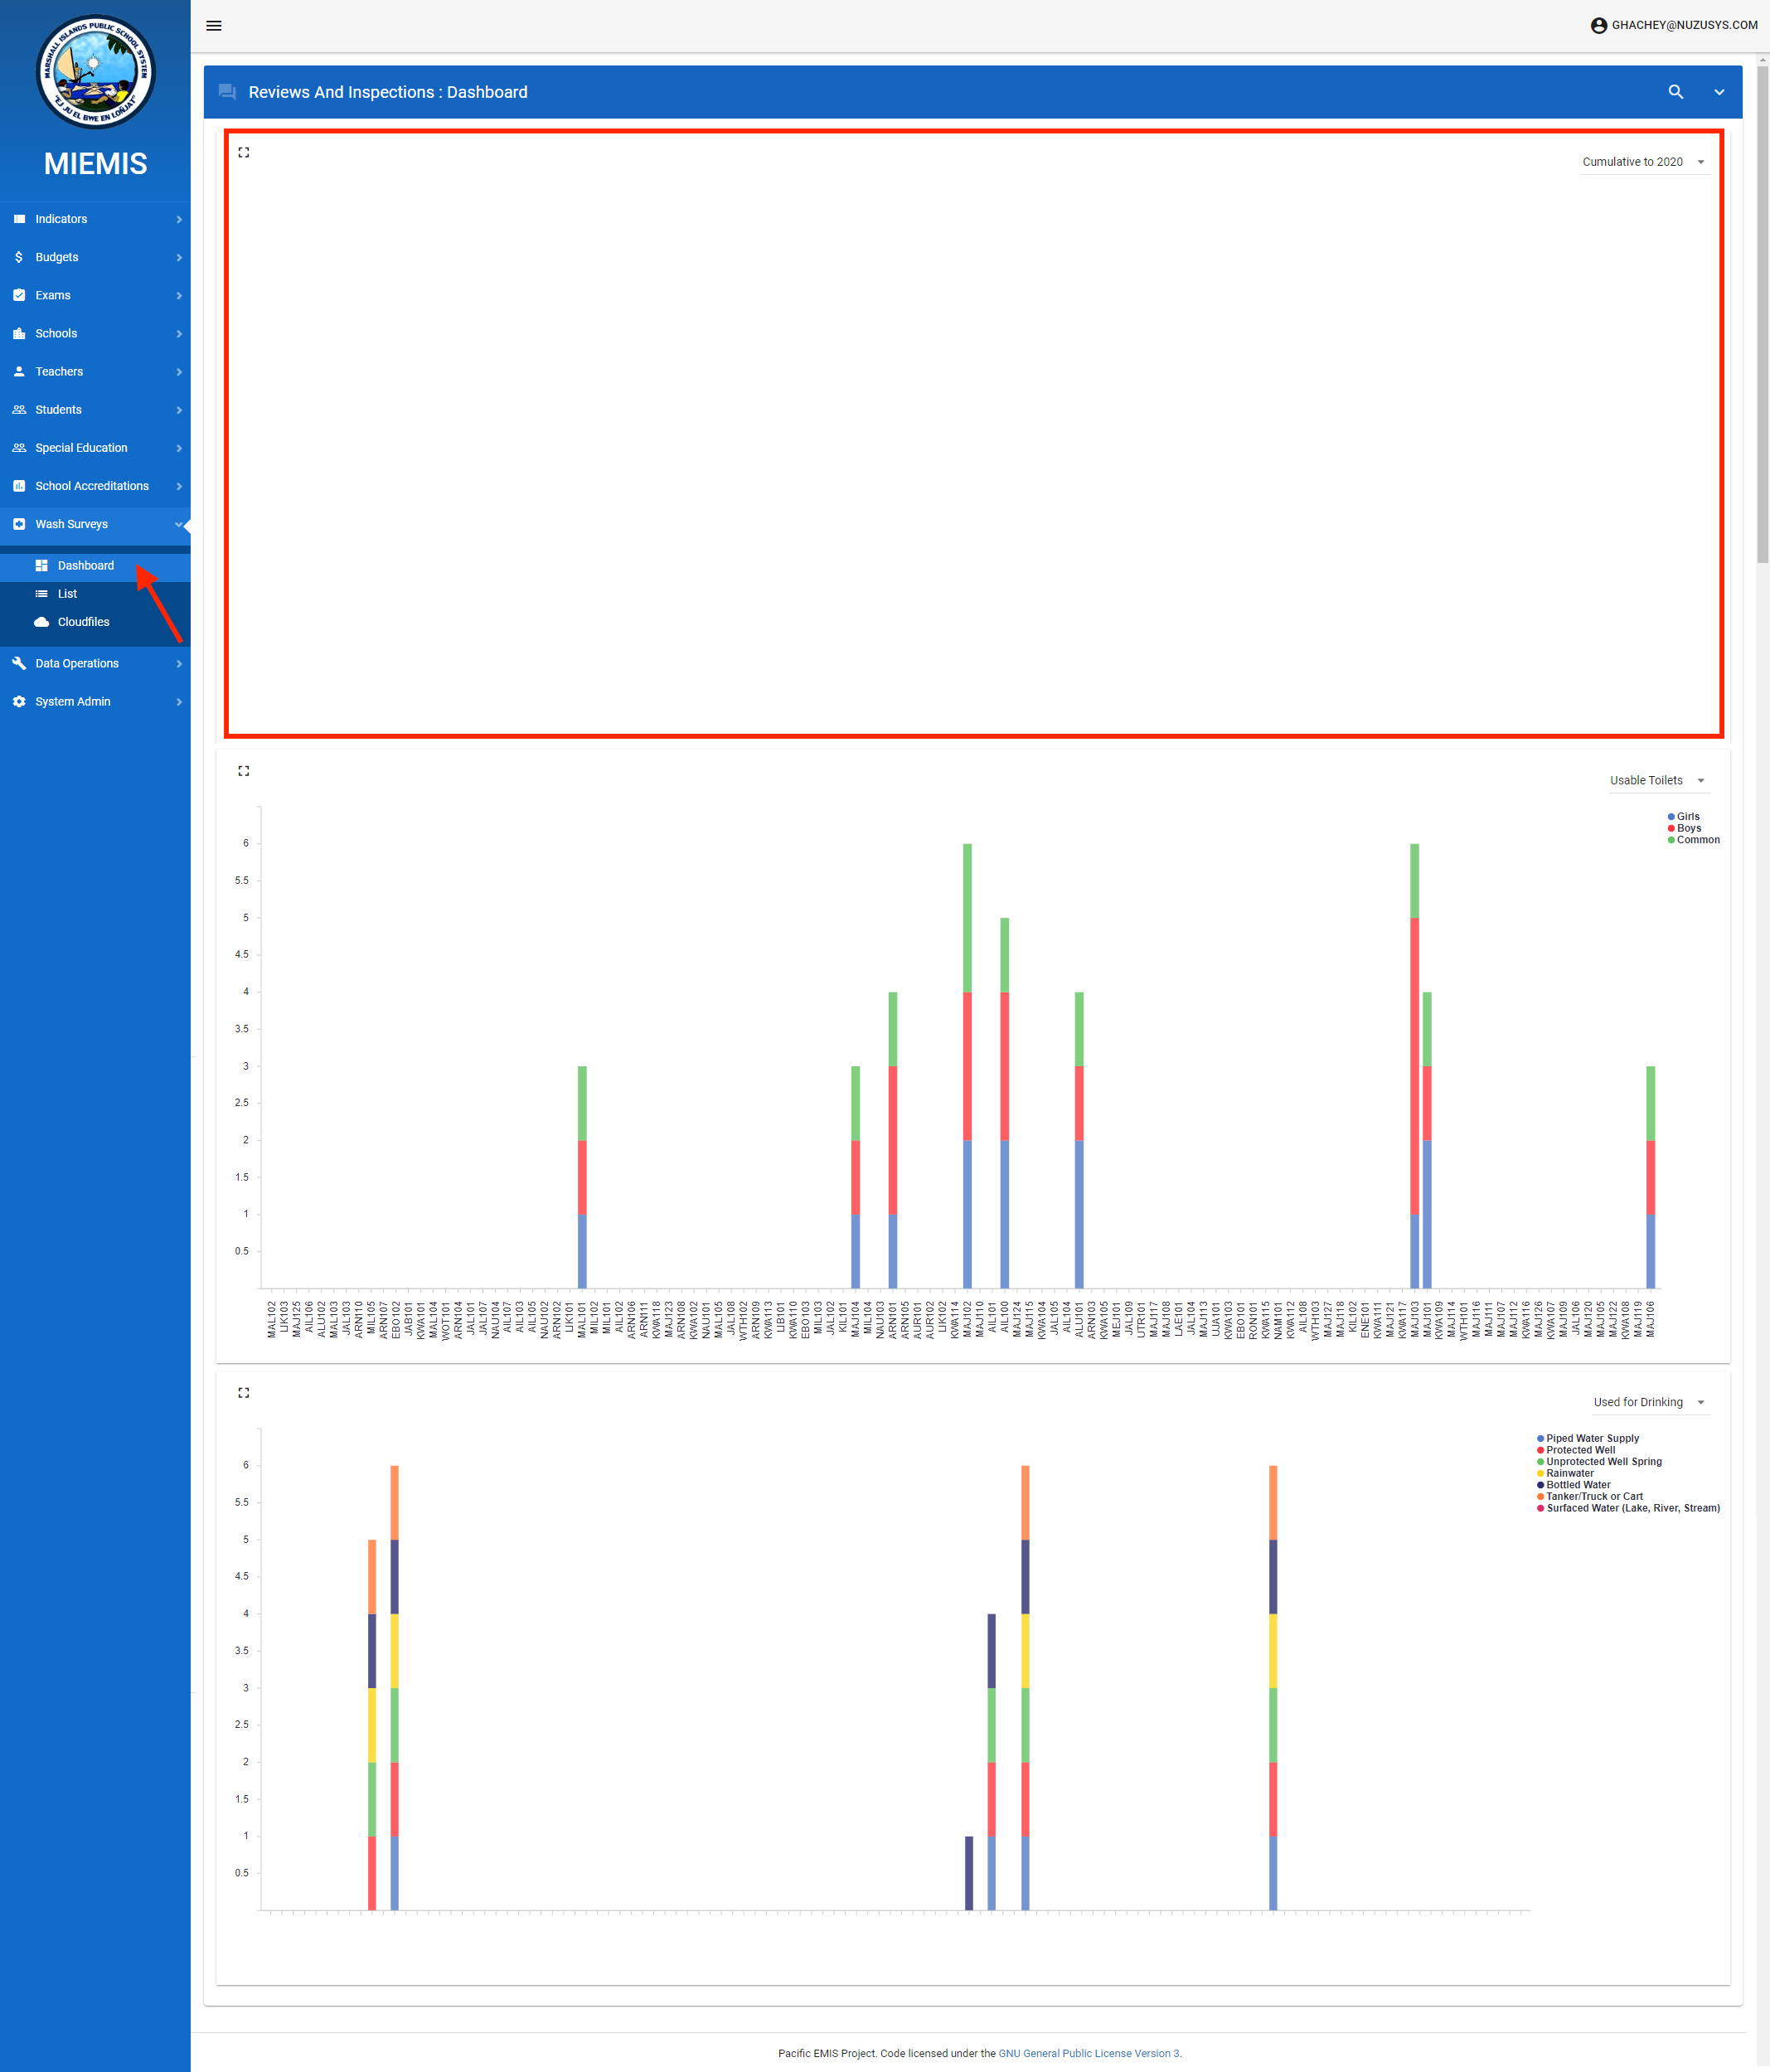
This is where you can get some live data analytics just like every other module in the EMIS. The data will only be available in the dashboard (and reports, etc.) once the cloud files are approved, loaded and the warehouse regenerated. You access just like other dashboard, Click on WASH Surveys → Dashboard.
The WASH dashboard has currently three main themes: analysis by Question, Pupil / Toilet indicators, Water sources.
Note from below when you load the dashboard the first dashboard component is empty by default. This is actually because it is a special and powerful dashboard interactive component. Due to the nature of the WASH survey with many questions of different nature it is not practical to have a one size fits all analysis. Displaying results for all the hundreds of questions on the survey would make the dashboard too large and slow.
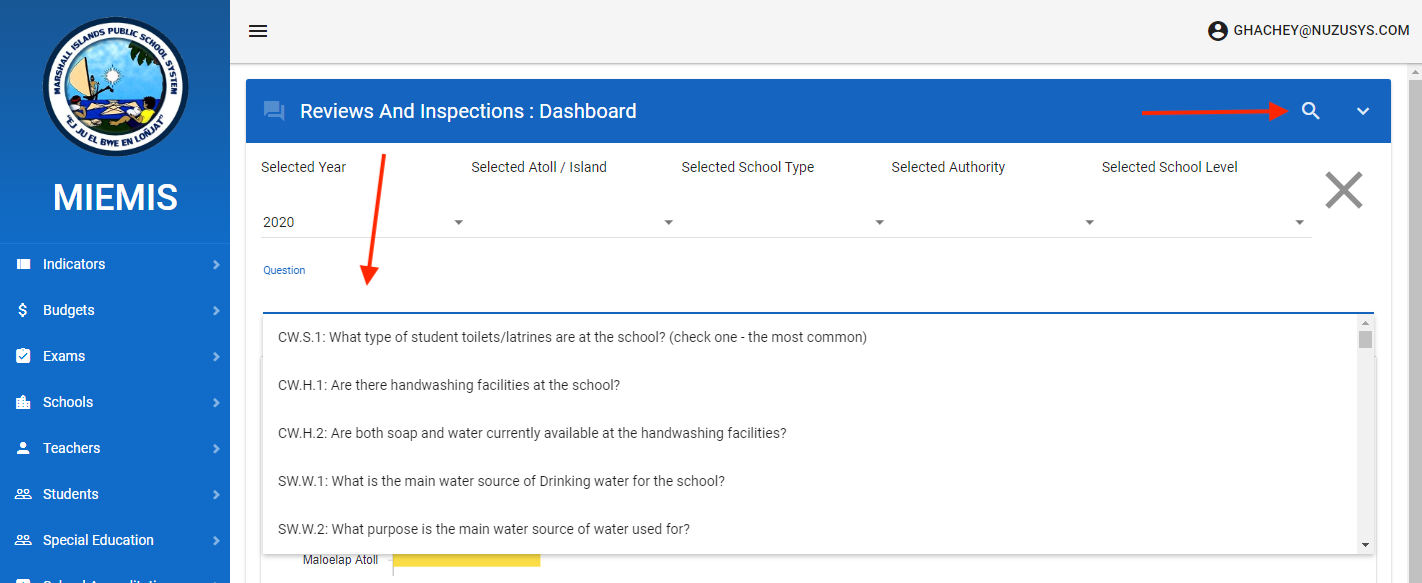
Instead, the dashboard offers a more interactive approach. The user needs to click on the magnifying glass to access the filters as usual. In there are the typical filters (i.e. Districts, School Type, Authority, School Level, etc.). But there is another special filter called Question. If you put your cursor in there you will see a drop down list of all the questions on the survey. You can query the system for information.
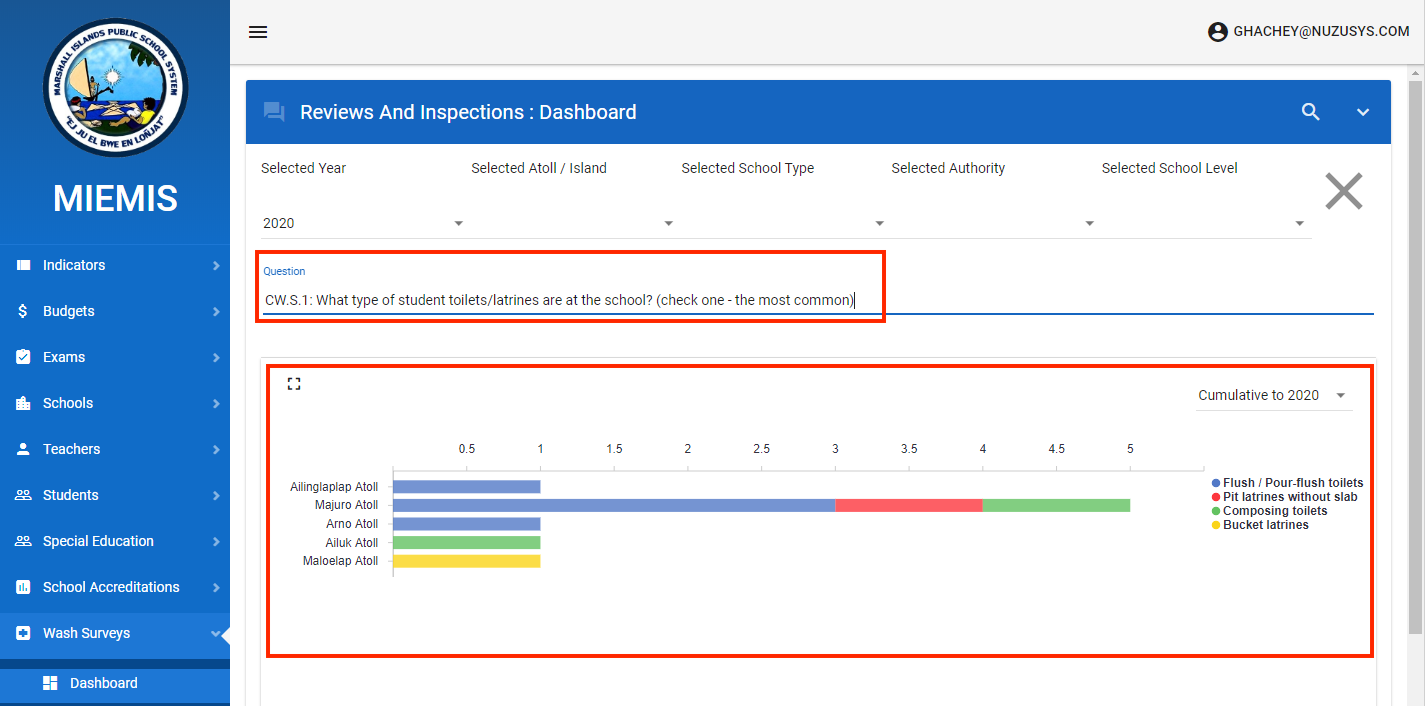
For example, select the question CW.S.1: What type of student toilets/latrines are at the school? (check one - the most common). You will get the following analysis providing you useful information. Obviously from below Maloelap Atoll is the one in more dire situation requiring immediate WASH infrastructure support (new toilets).
The question tool provides aggregated responses to each question on the WASH survey. As with the school accreditation dashboard, you may choose between Cumulative display, and Evaluated In display.
- Cumulative to [YEAR]: reports on the best (ie most recent) WASH survey for each school, up to and including the reporting year. Thus, each school is represented at most once in the chart. If that school has no WASH survey up to and including the reporting year, it is not included in the Cumulative view.
- Evaluated in [YEAR]: In view shows only results from WASH surveys conducted in the reporting year. If a school has more than one WASH survey in that year , only the most recent is included.
There are various types of questions in the WASH survey. Here is how each type of question is reported:
- Multiple choice - single select: The count of responses for each choice is reported.
- Multiple Choice - multiple select: The count of responses for each choice is reported. Note that since a single survey may have more than one selection, the total of responses tallied for this question may exceed the number of surveys.
- Yes/No: Counts the number of YES responses and the number of NO responses.
- Yes/No/Don't Know: Counts the number of each response.
- Quantity: The question has a numeric answer. The answers are summed to make the chart.
You still have access to your standard filters, For example, bellow we filter to only analyze for the Majuro Atoll which will update the whole dashboard for Majuro Analysis.
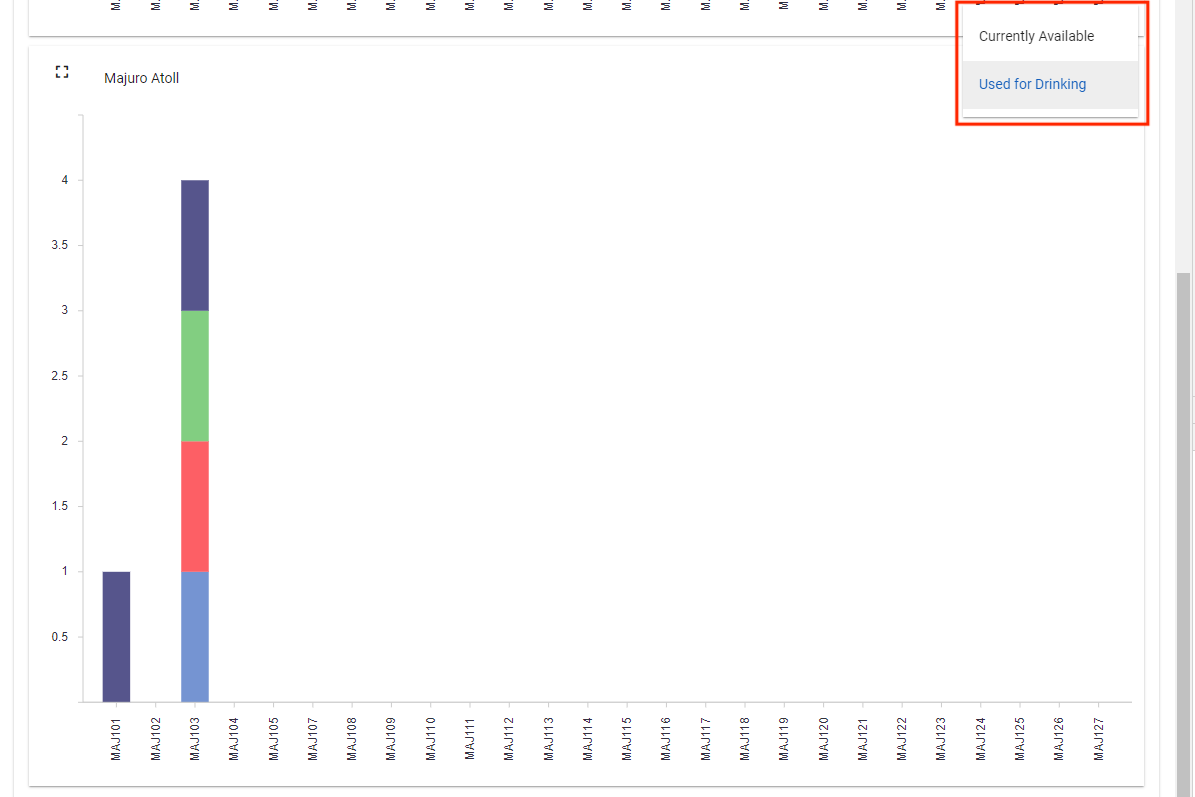
Also take note of the next two dashboard components. One provides dedicated analysis for toilets while the other for source of water at the school.
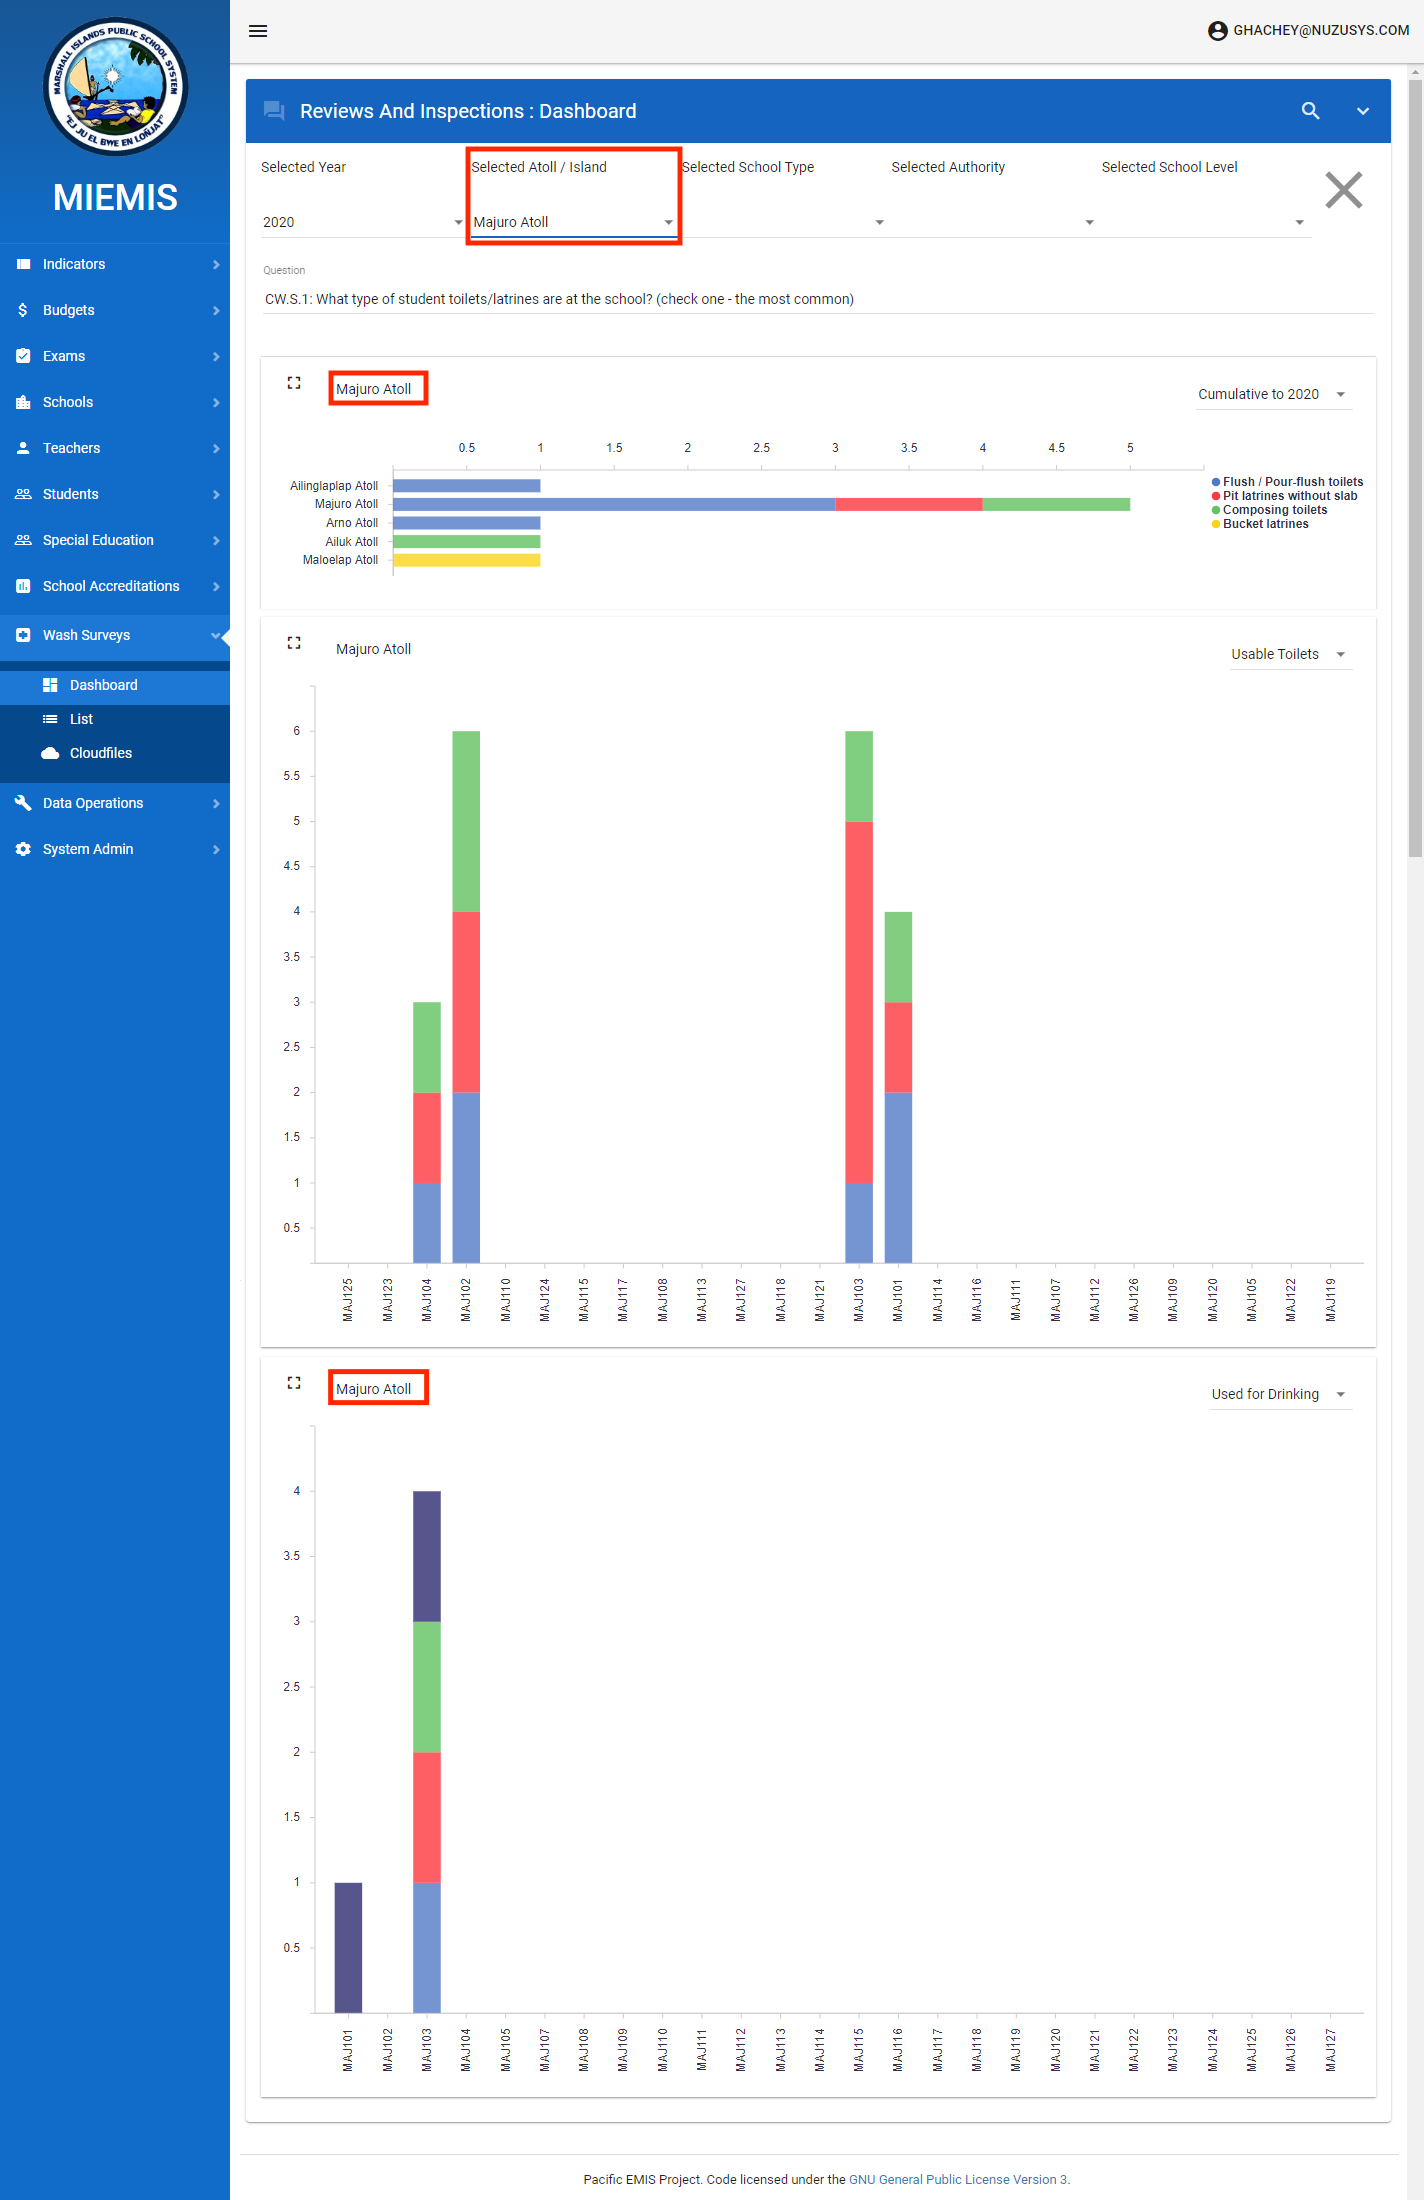
It is an important indicator to know the number of pupils per toilet, both in total, and for boys and girls. Often this target will be set as a “quality standard”, and a program of construction will be put in place to ensure each school meets this required standard. The toilet numbers component shows a range of indicators for each school in the set of schools selected by the Options box. Note that this dashboard components does not aggregate across schools–instead, it shows a bar for each selected school.
In addition to standard dashboard wide filters some individual dashboard components have their own filters as well. For example, the toilet dashboard component can display any of the following as outlined in red rectangle below.
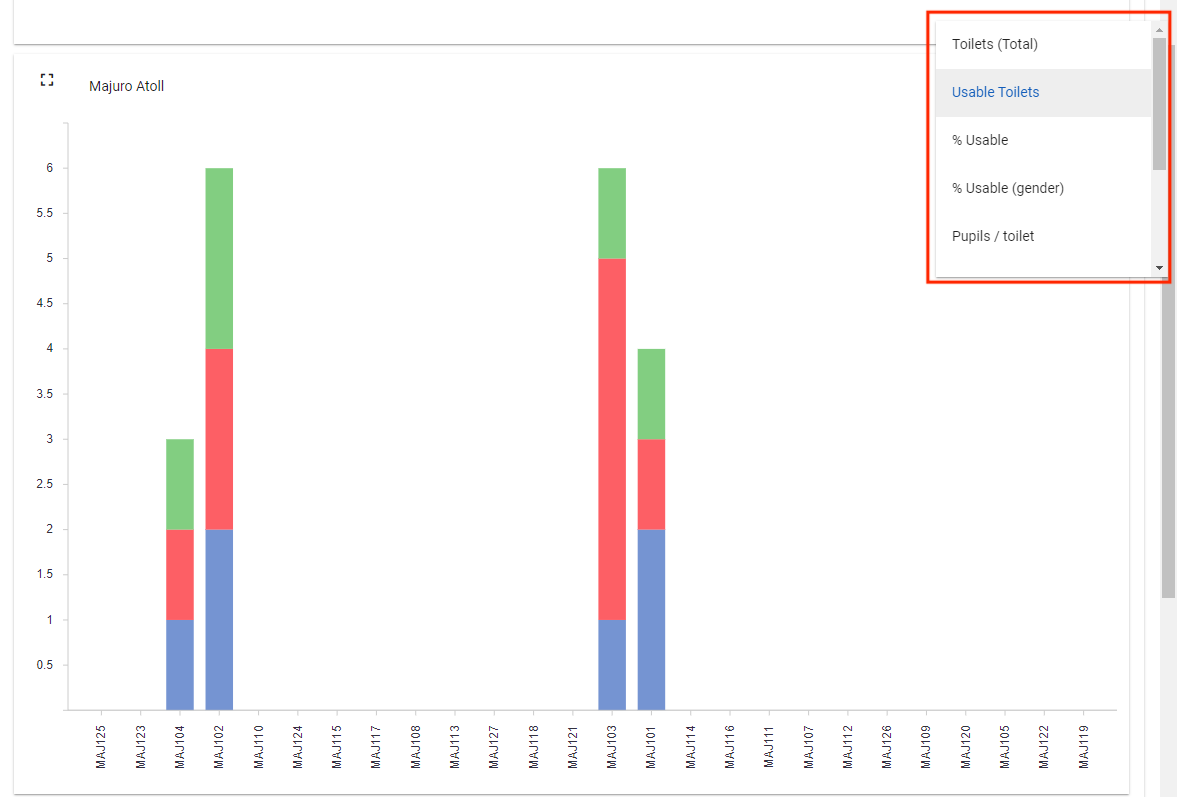
- Toilets (Total): analysis on total toilets (whether usable or not). This is a stacked chart, showing, Boys, Girls and Common use toilets.
- Usable Toilets: analysis only on usable toilets. This also is a stacked chart, showing, Boys, Girls and Common use toilets
- % Usable: the total number of usable toilets as a percentage of total toilets.
- % Usable (Gender): the total number of usable toilets as a percentage of total toilets, separating boys and girls toilets. Note that it is not meaningful to “stack” (i.e. add) these percentages, so they are shown on opposite sides of the chart axis. Common use toilets are not included in this analysis.
- Pupil / toilet: the total number of pupils at the school (from the relevant census workbook) divided by the total number of toilets.
- Pupil / toilet (gender): the total number of boy/girls at the school (from the relevant census workbook) divided by the total number of boys/girls toilets. Note that common use toilets are not included in this analysis.
- Pupil / usable toilet: the total number of pupils at the school (from the relevant census workbook) divided by the total number of usable toilets.
- Pupil / usable toilet (gender): the total number of boy/girls at the school (from the relevant census workbook) divided by the total number of usable boys/girls toilets. Note that common use toilets are not included in this analysis.
- Pupil: for reference the number of pupils at the school, as taken from the last workbook census.
Similarly, the water source dashboard component can display the following versions
- Currently available: total water source analysis whether it can be used for drinking or not
- Used for drinking: water source that can be used for drinking analysis
WASH Surveys Reports
Scholarships
The scholarship module of the EMIS assist in managing scholarships data. It can record student scholarships, track various life cycle status, record allocated money, generate report and more. It will be detailed in the following subsections.
Configuration
Most of the configuration only needs to be done once or very rarely. One configuration needs to be done yearly.
Initial Configuration
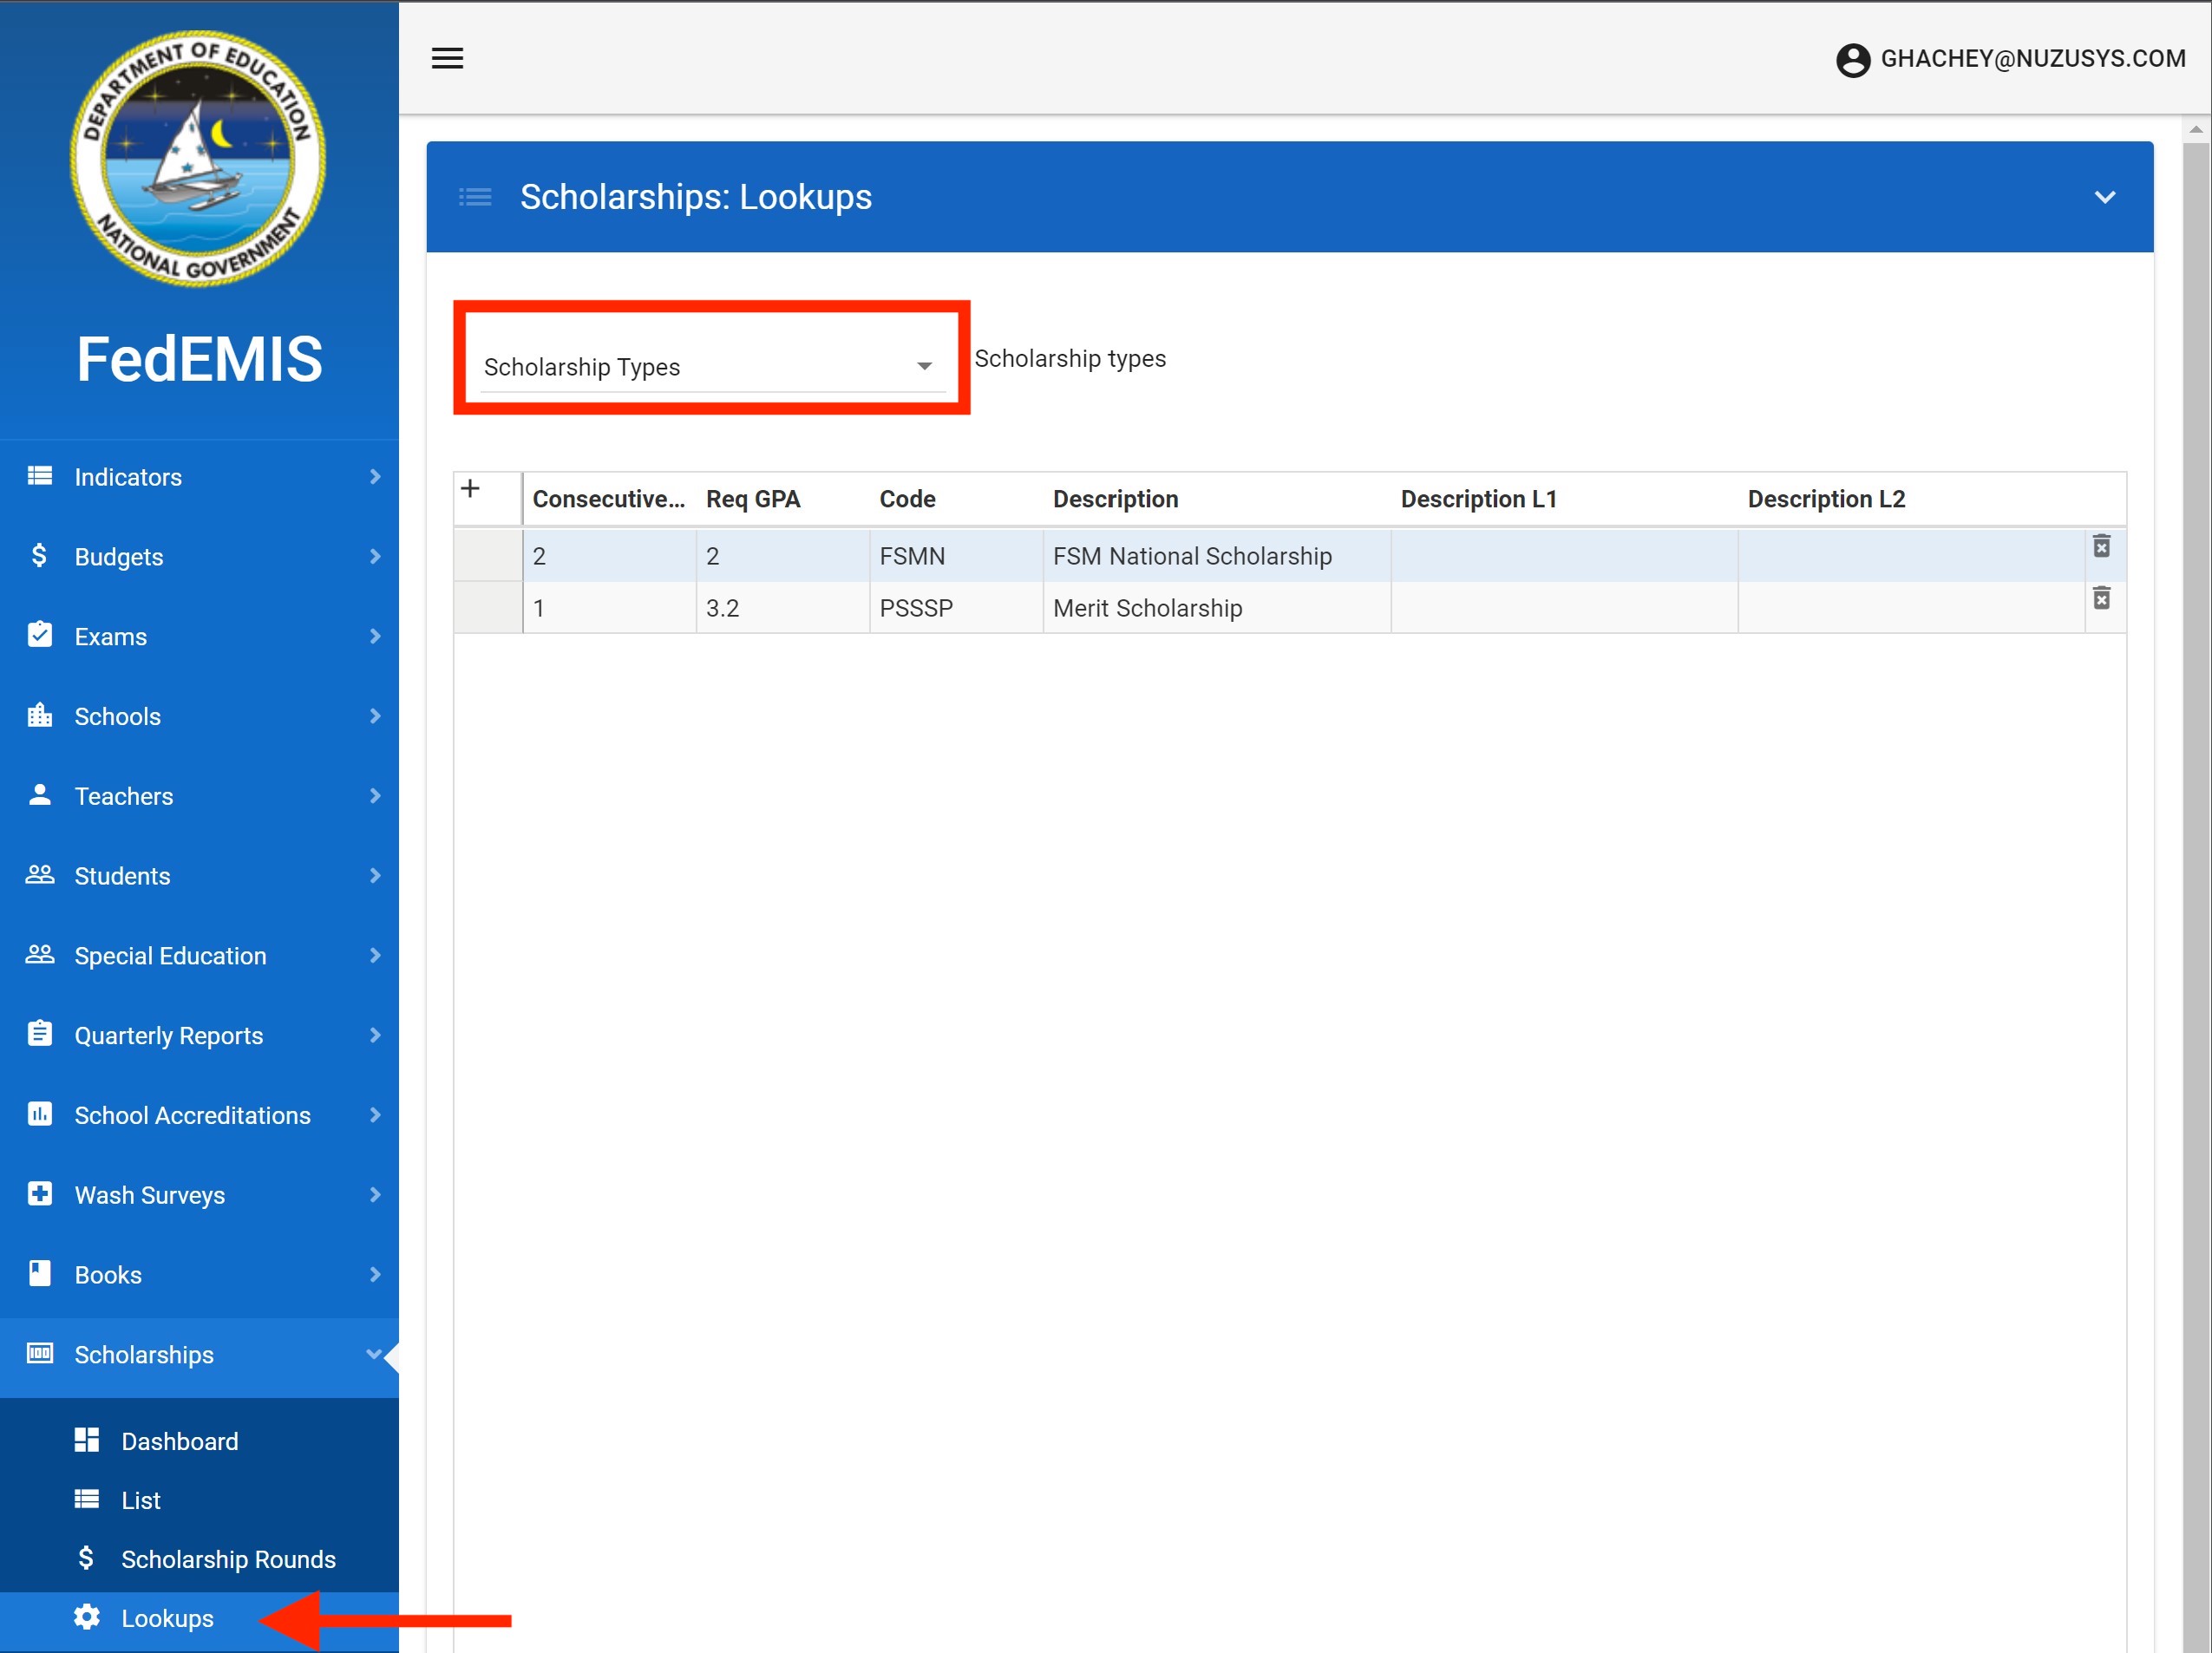
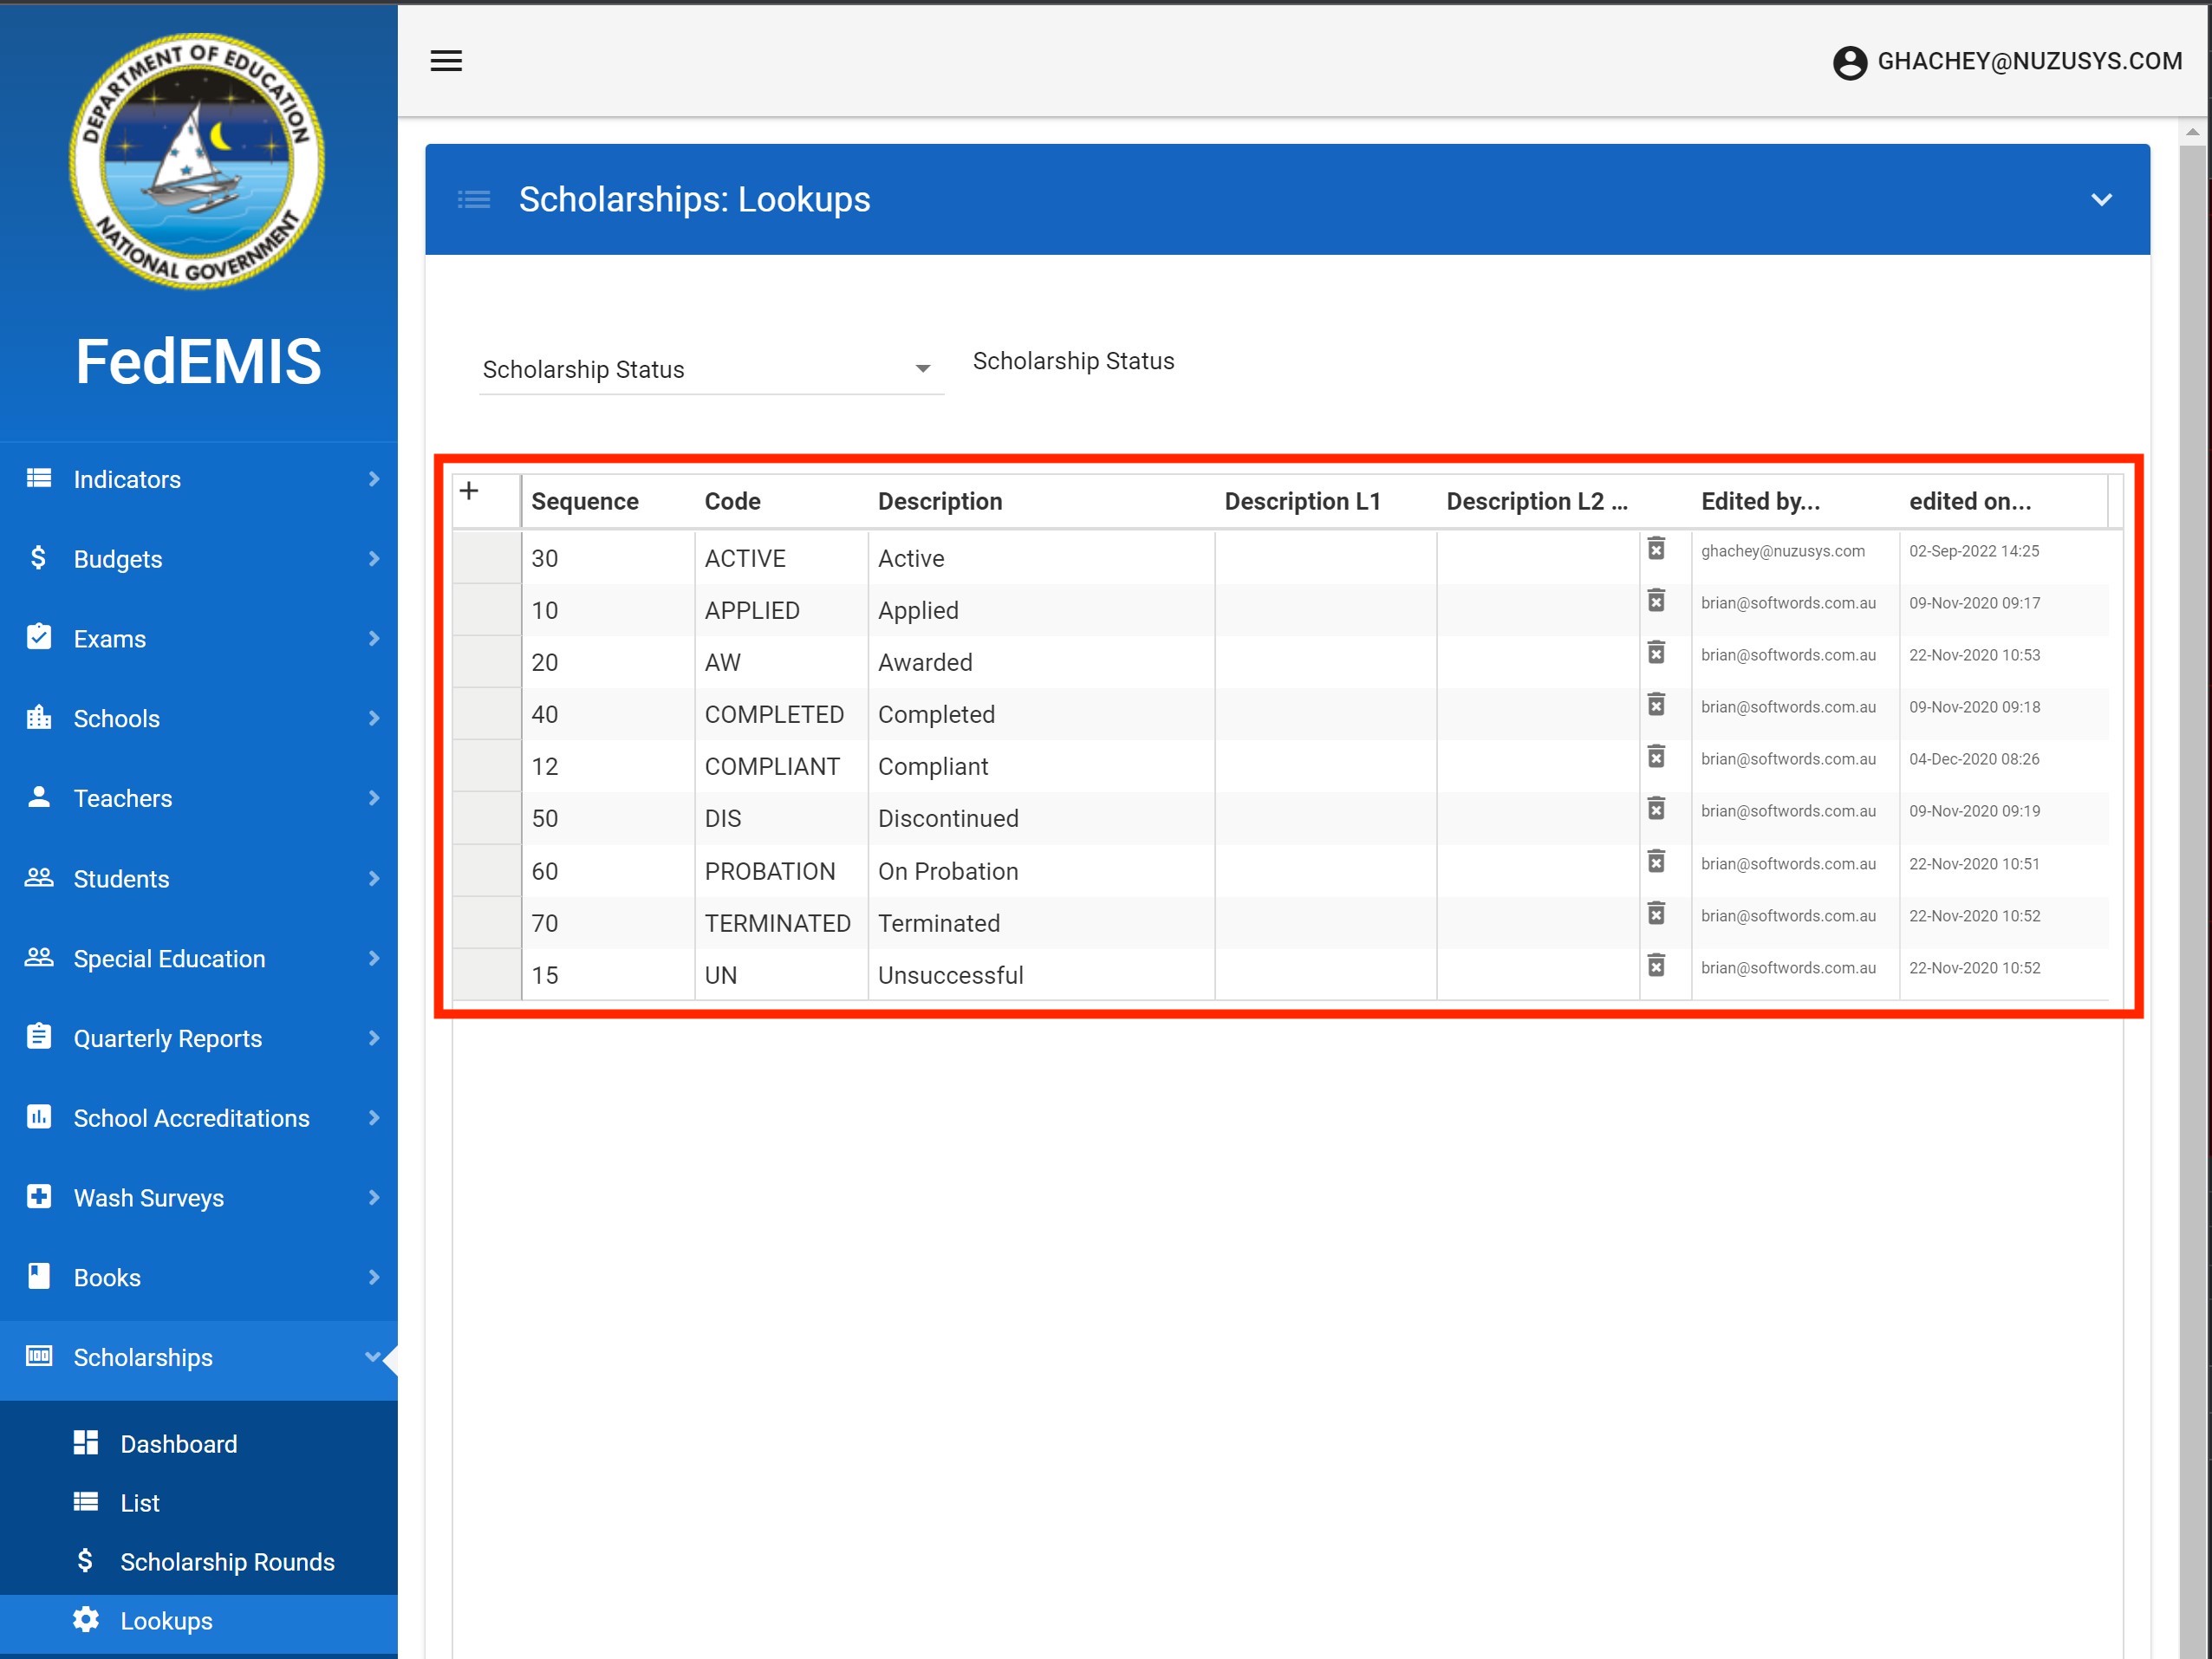
All the configuration for the scholarships module can be found under Scholarships → Lookups. First the scholarship types. You can configure your types of scholarships along with some basic requirements like the maximum number of consecutive terms below the minimum required GPA.
The various scholarship statuses as shown below.
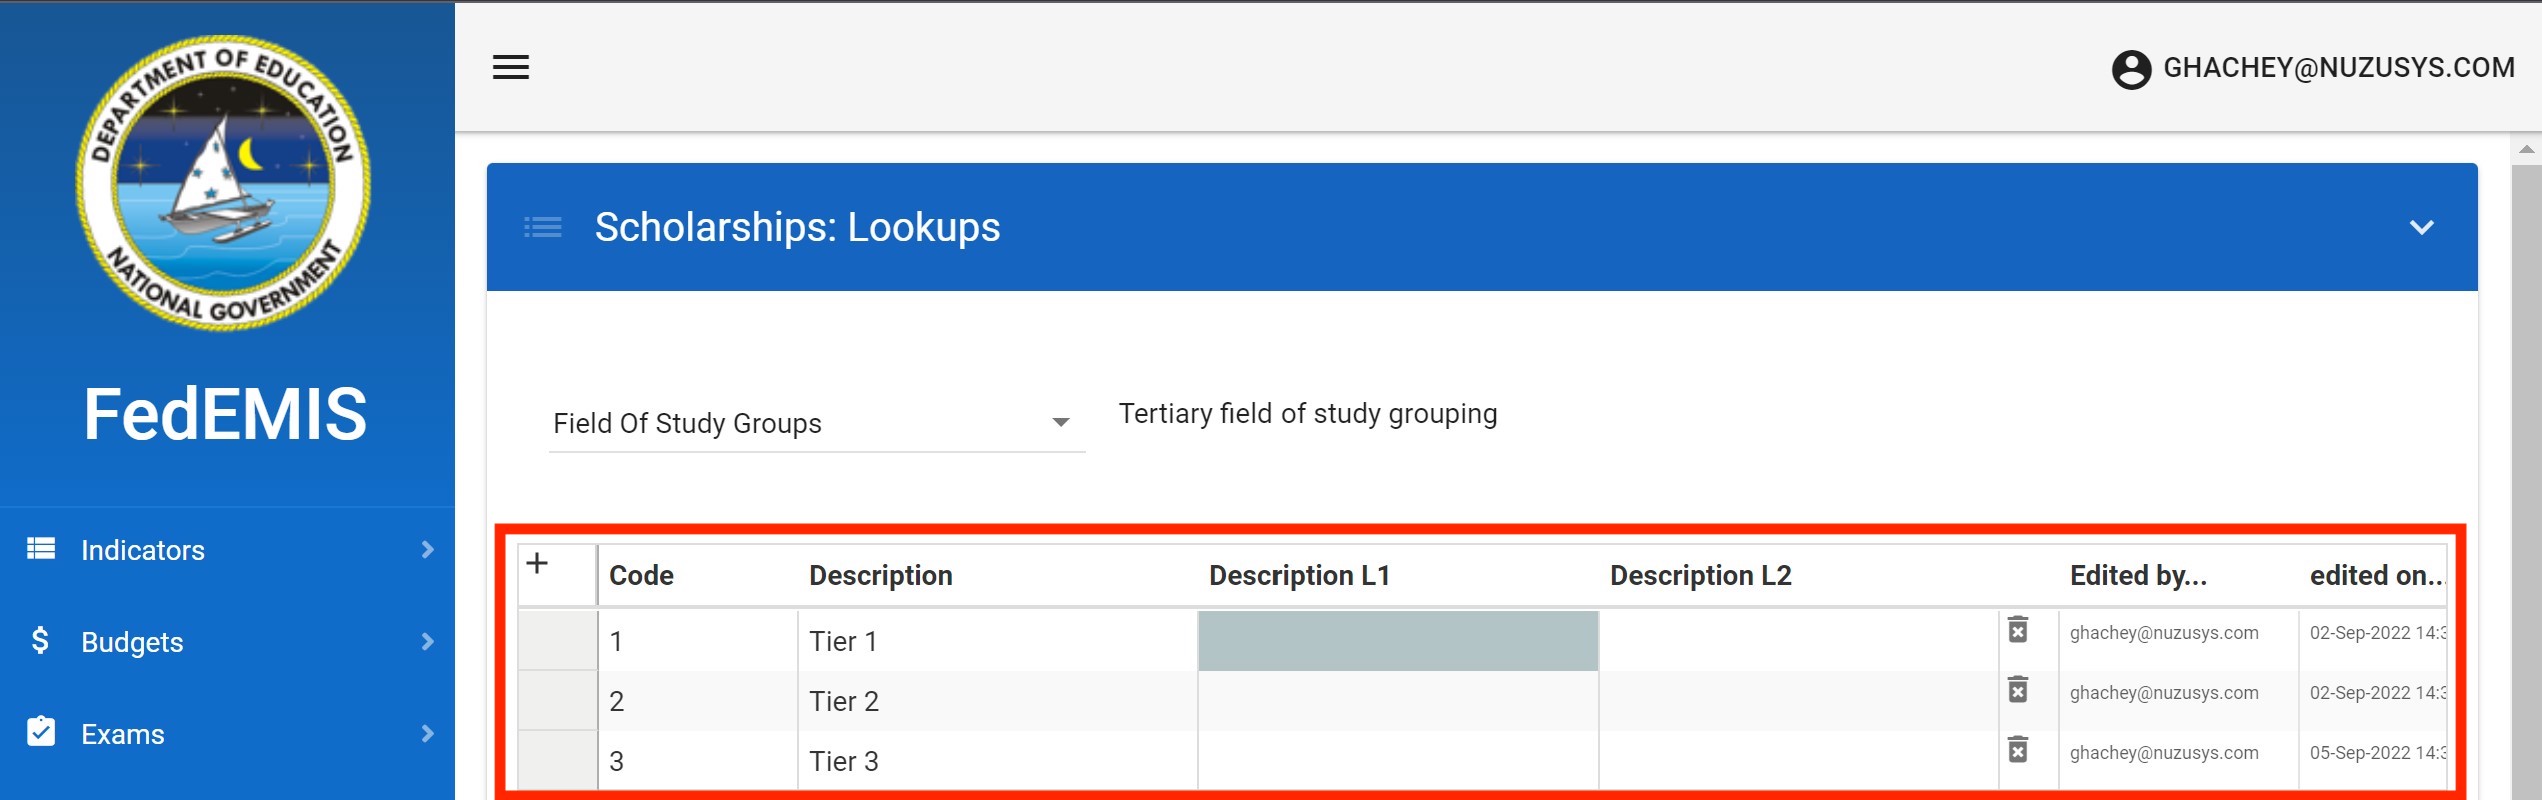
The fields of study groups.
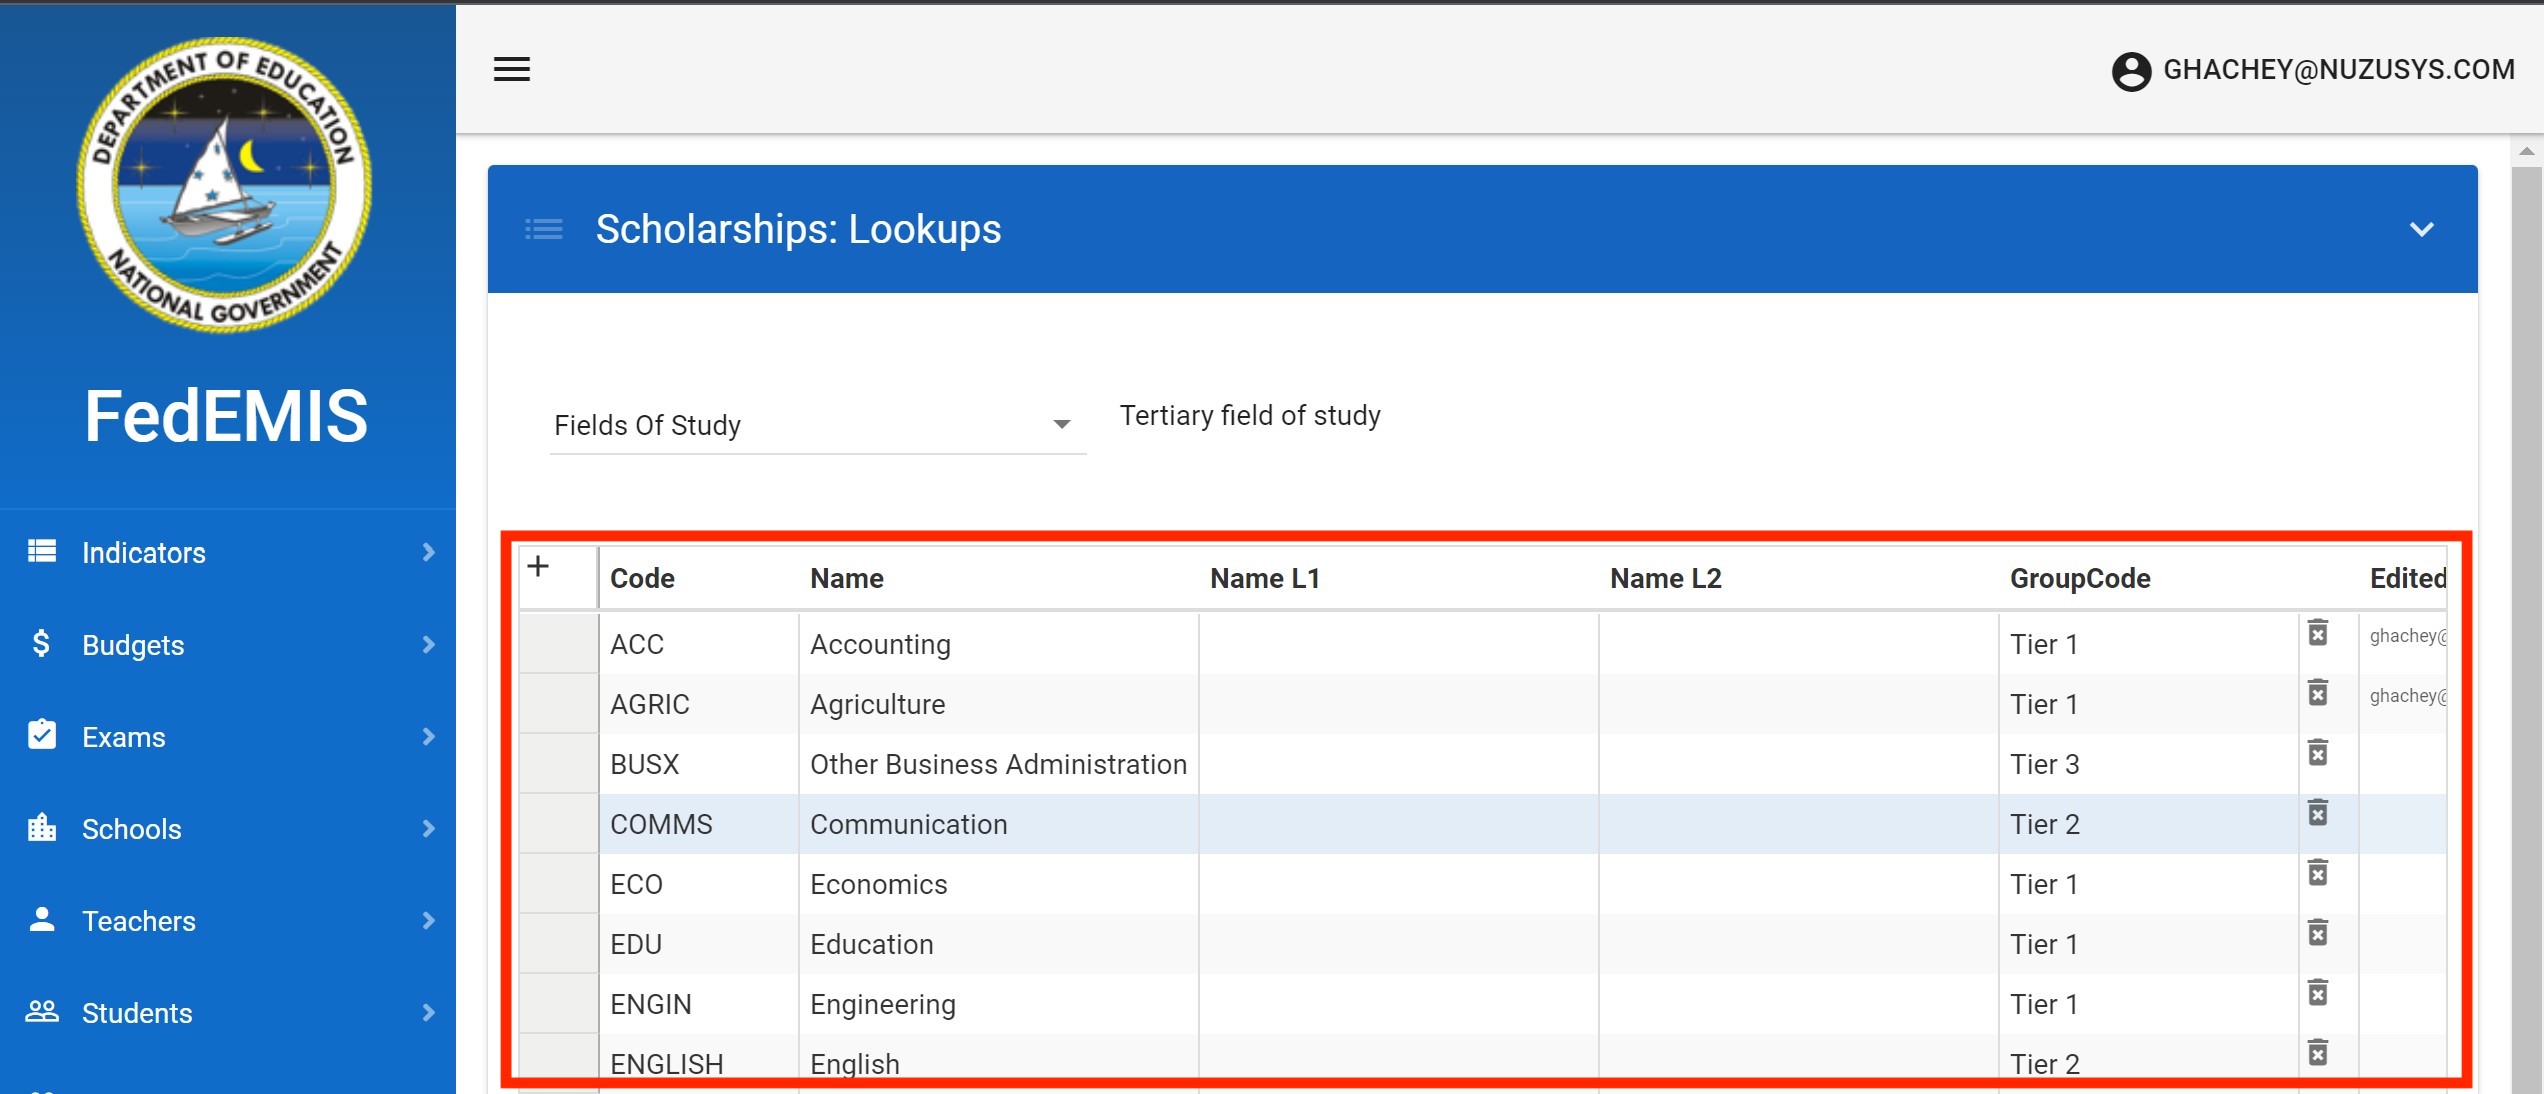
The fields of study.
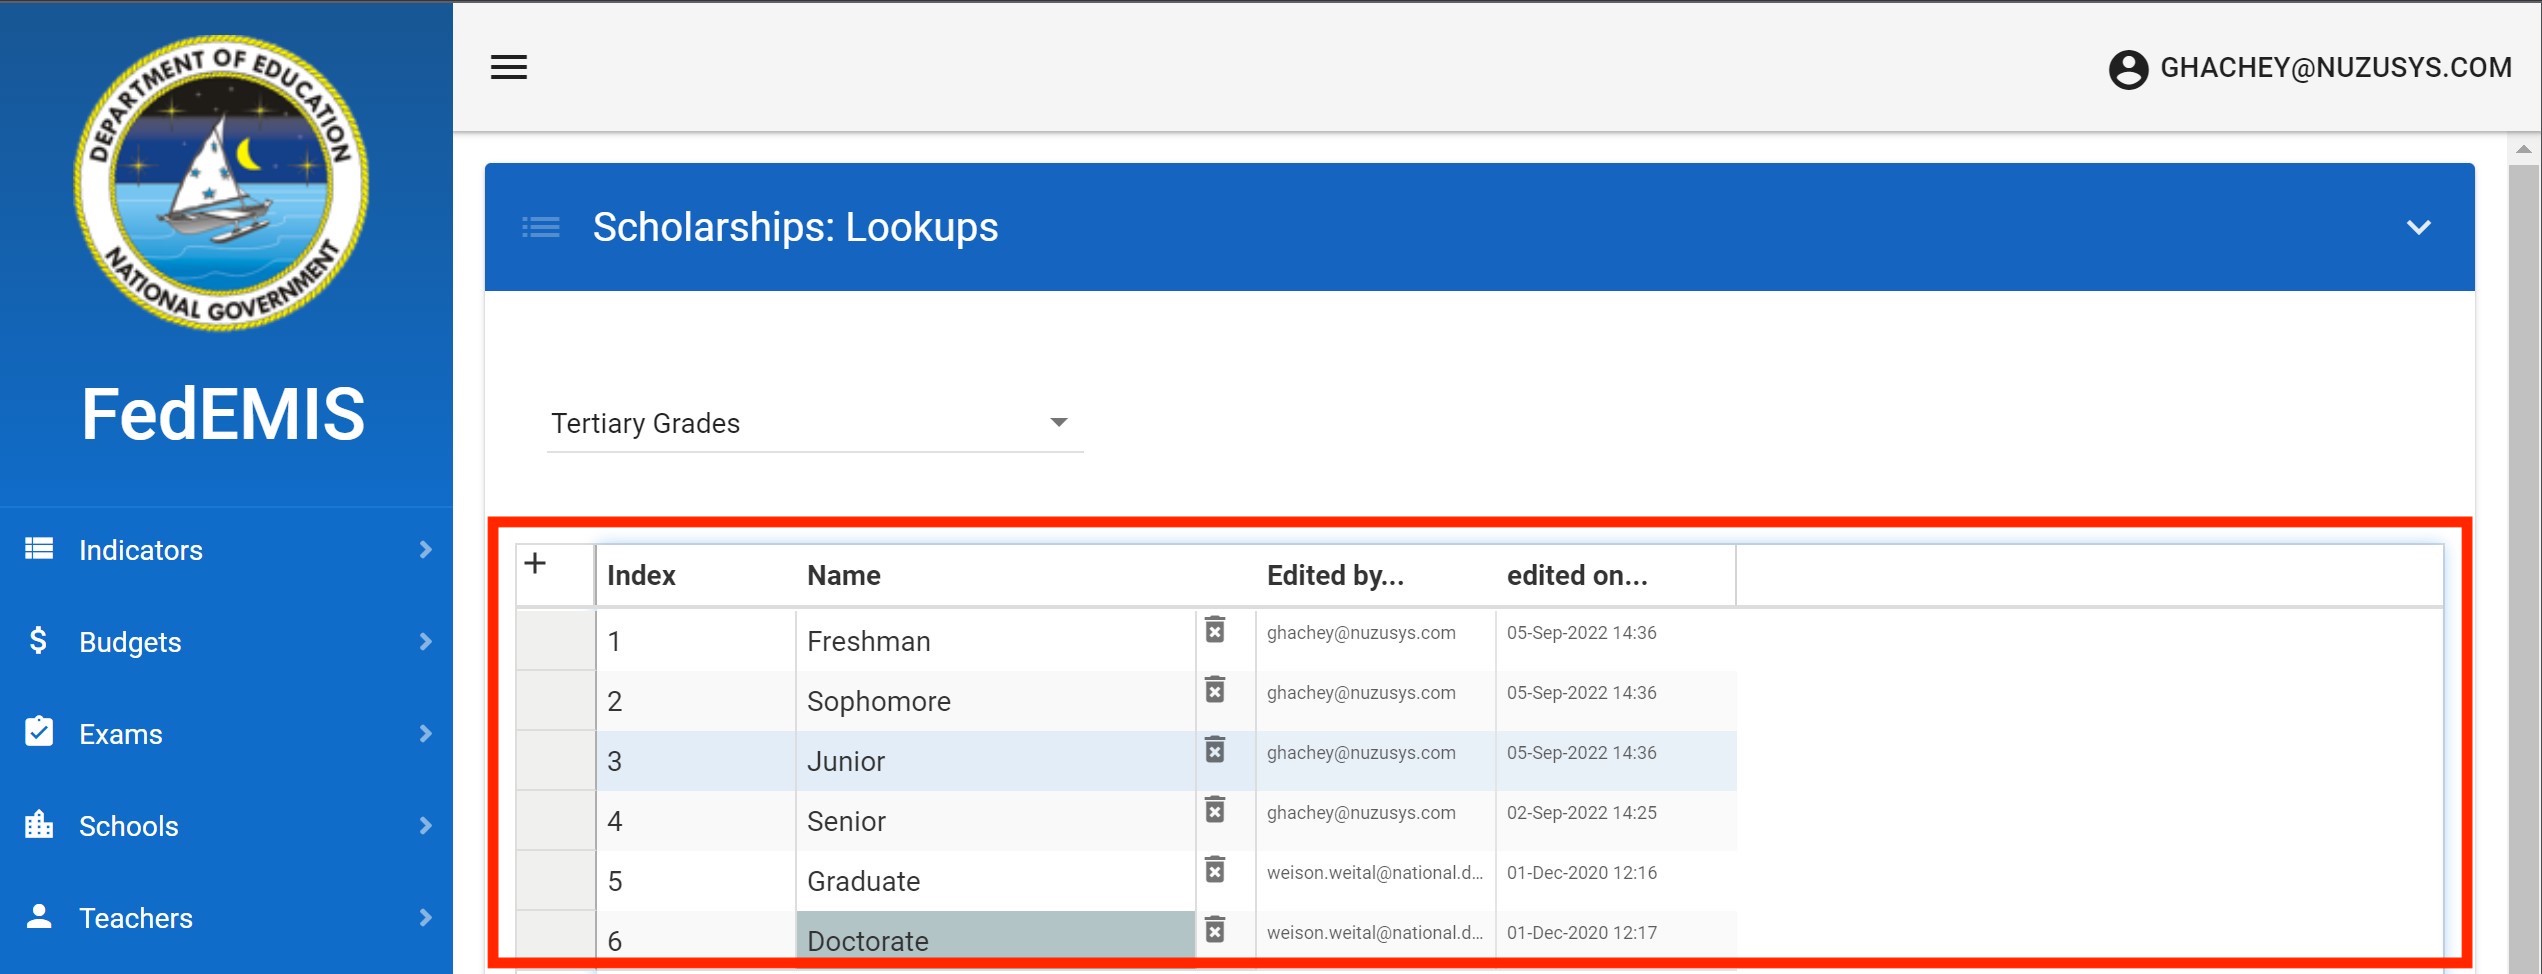
The tertiary class levels or grades.
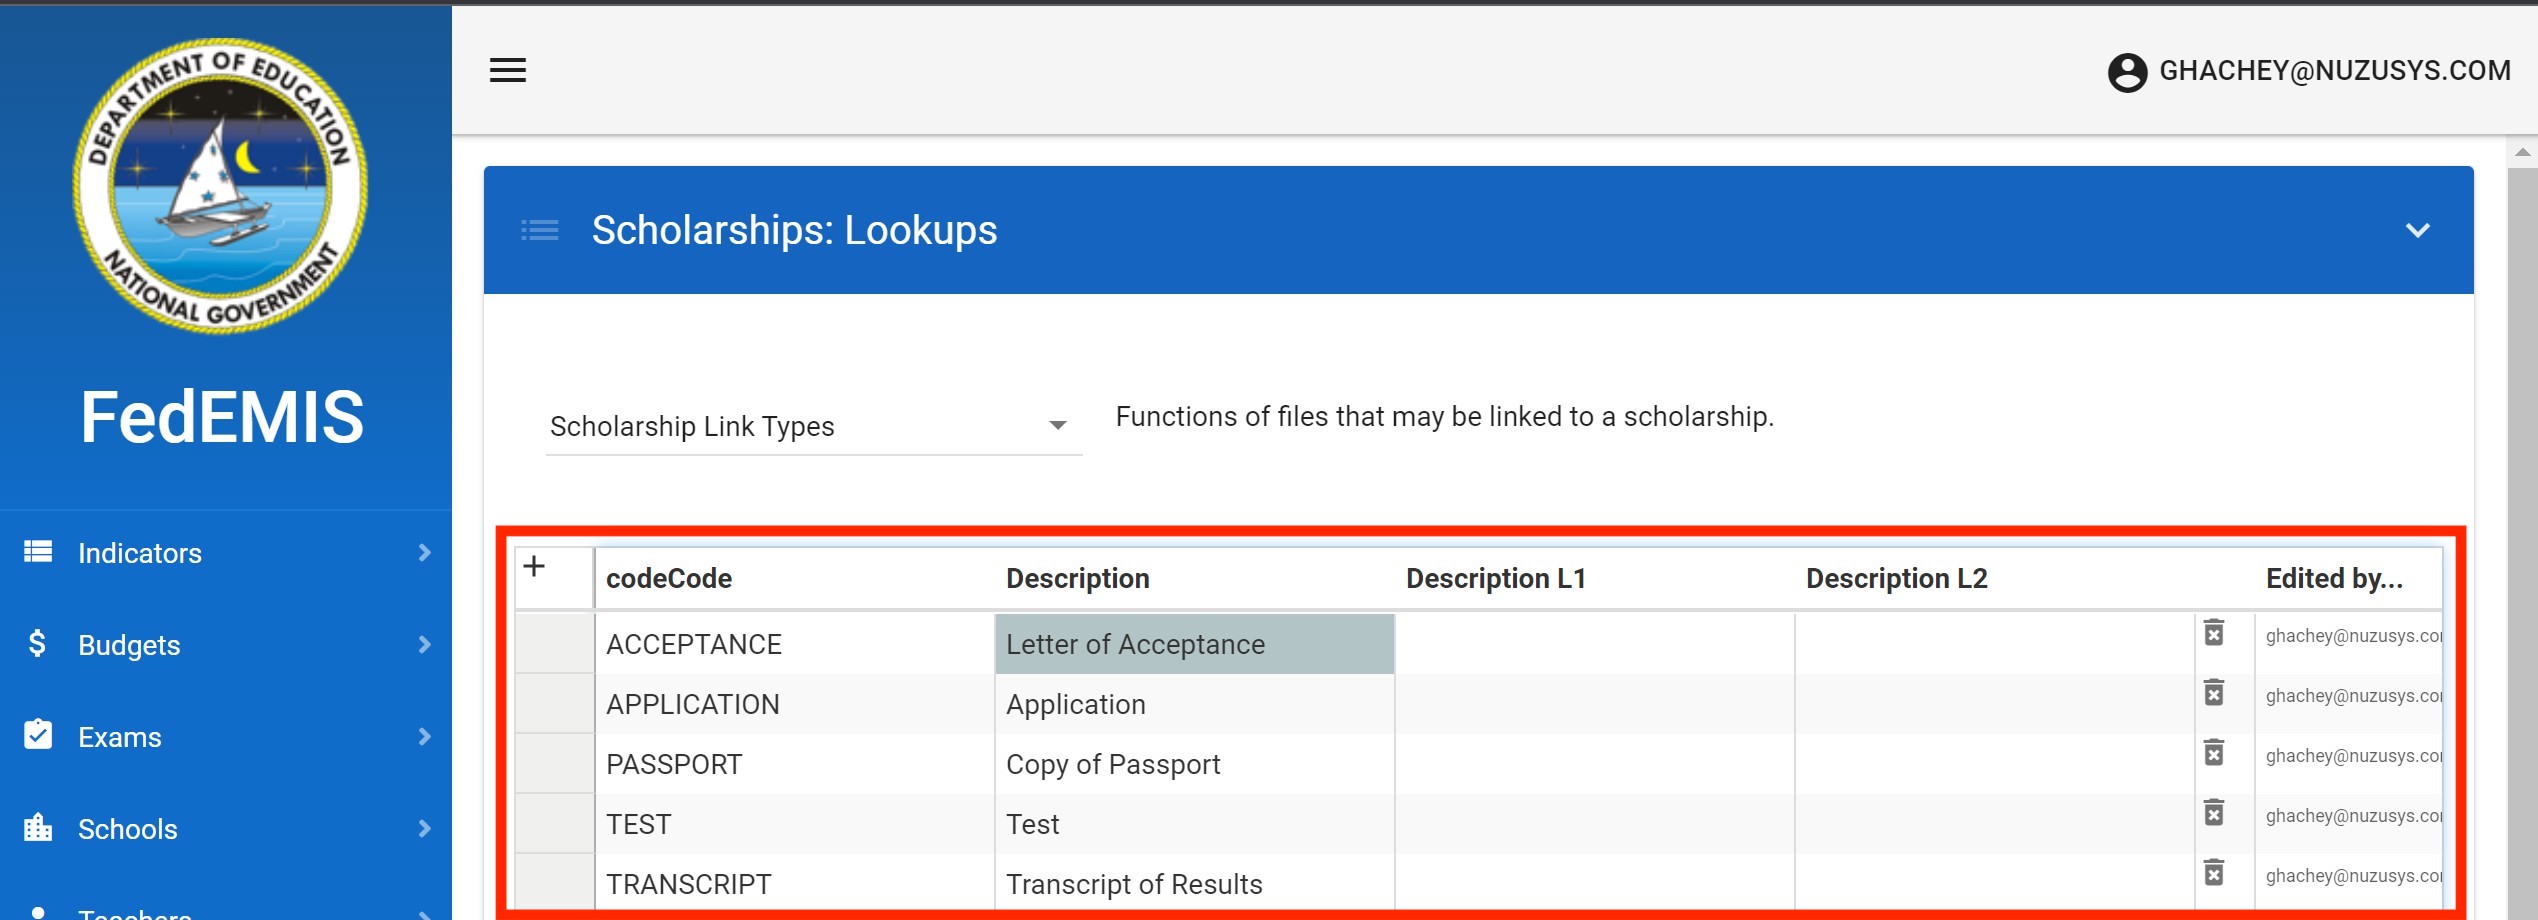
The scholarship link type (i.e. document types). Below you can define the types of documents you may archive along with the scholarships records.
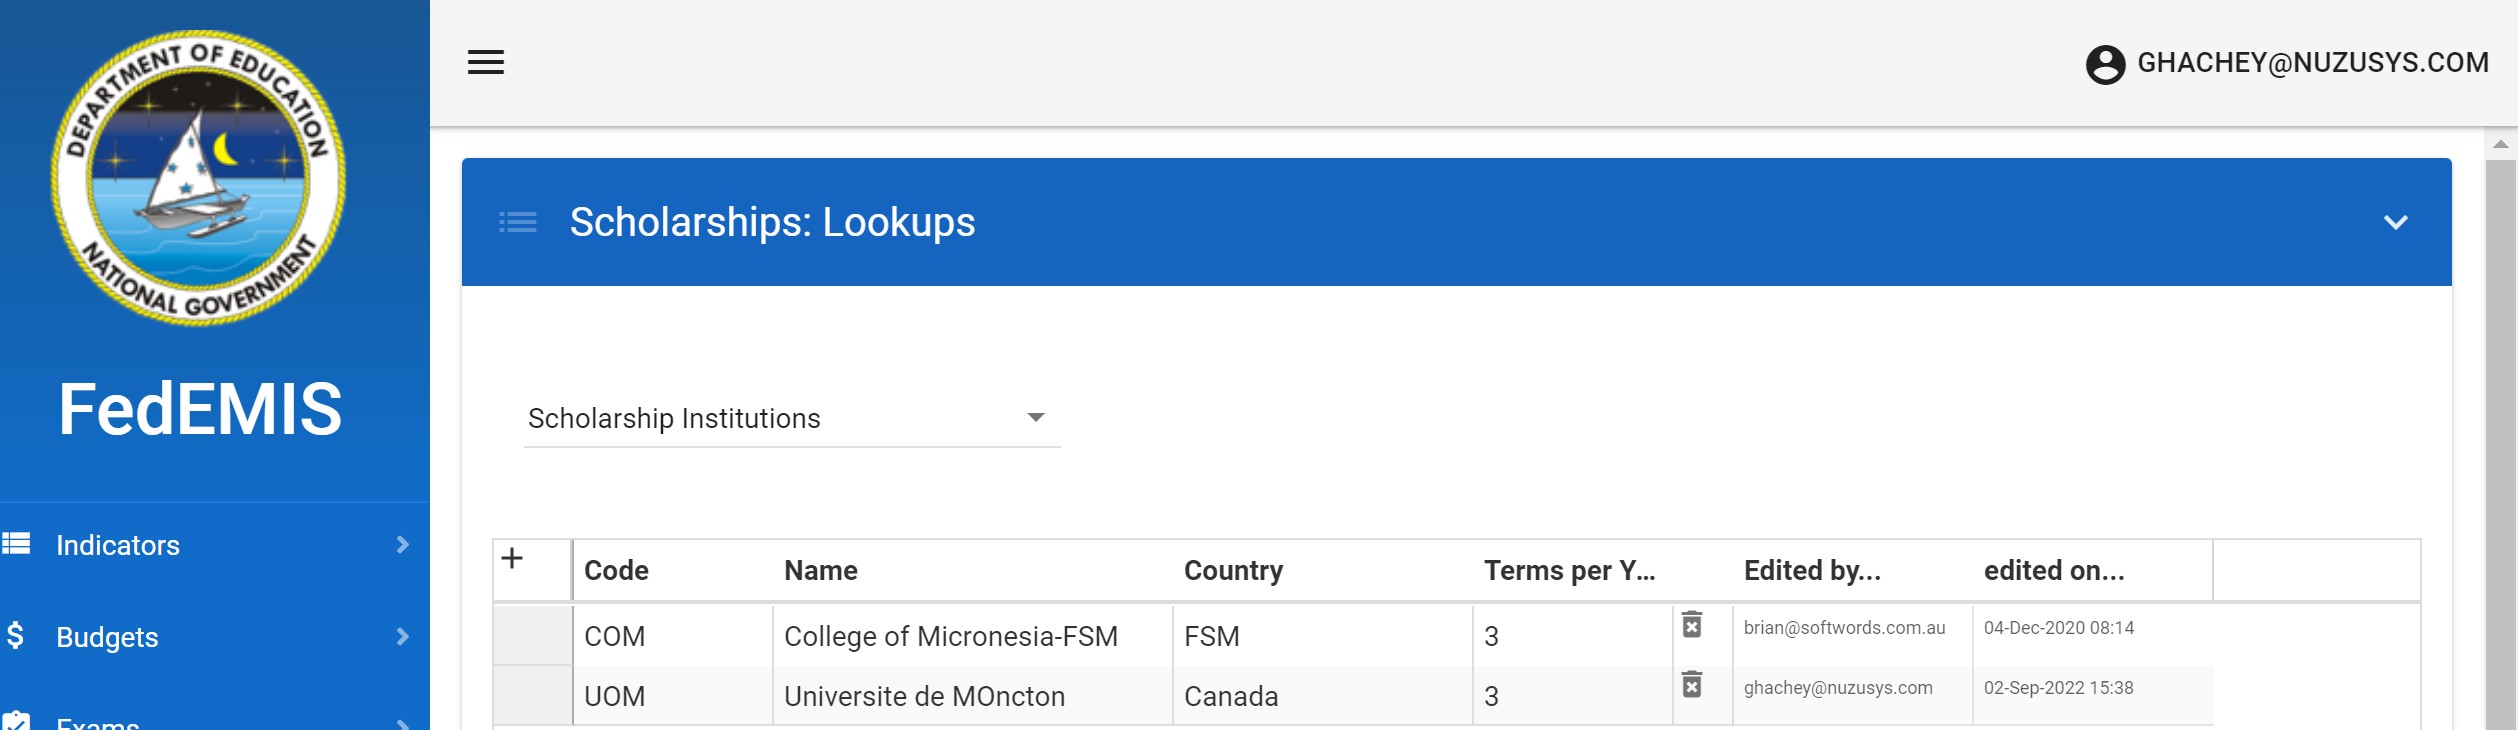
The institutions that the students go to with their scholarships.
Yearly Configuration
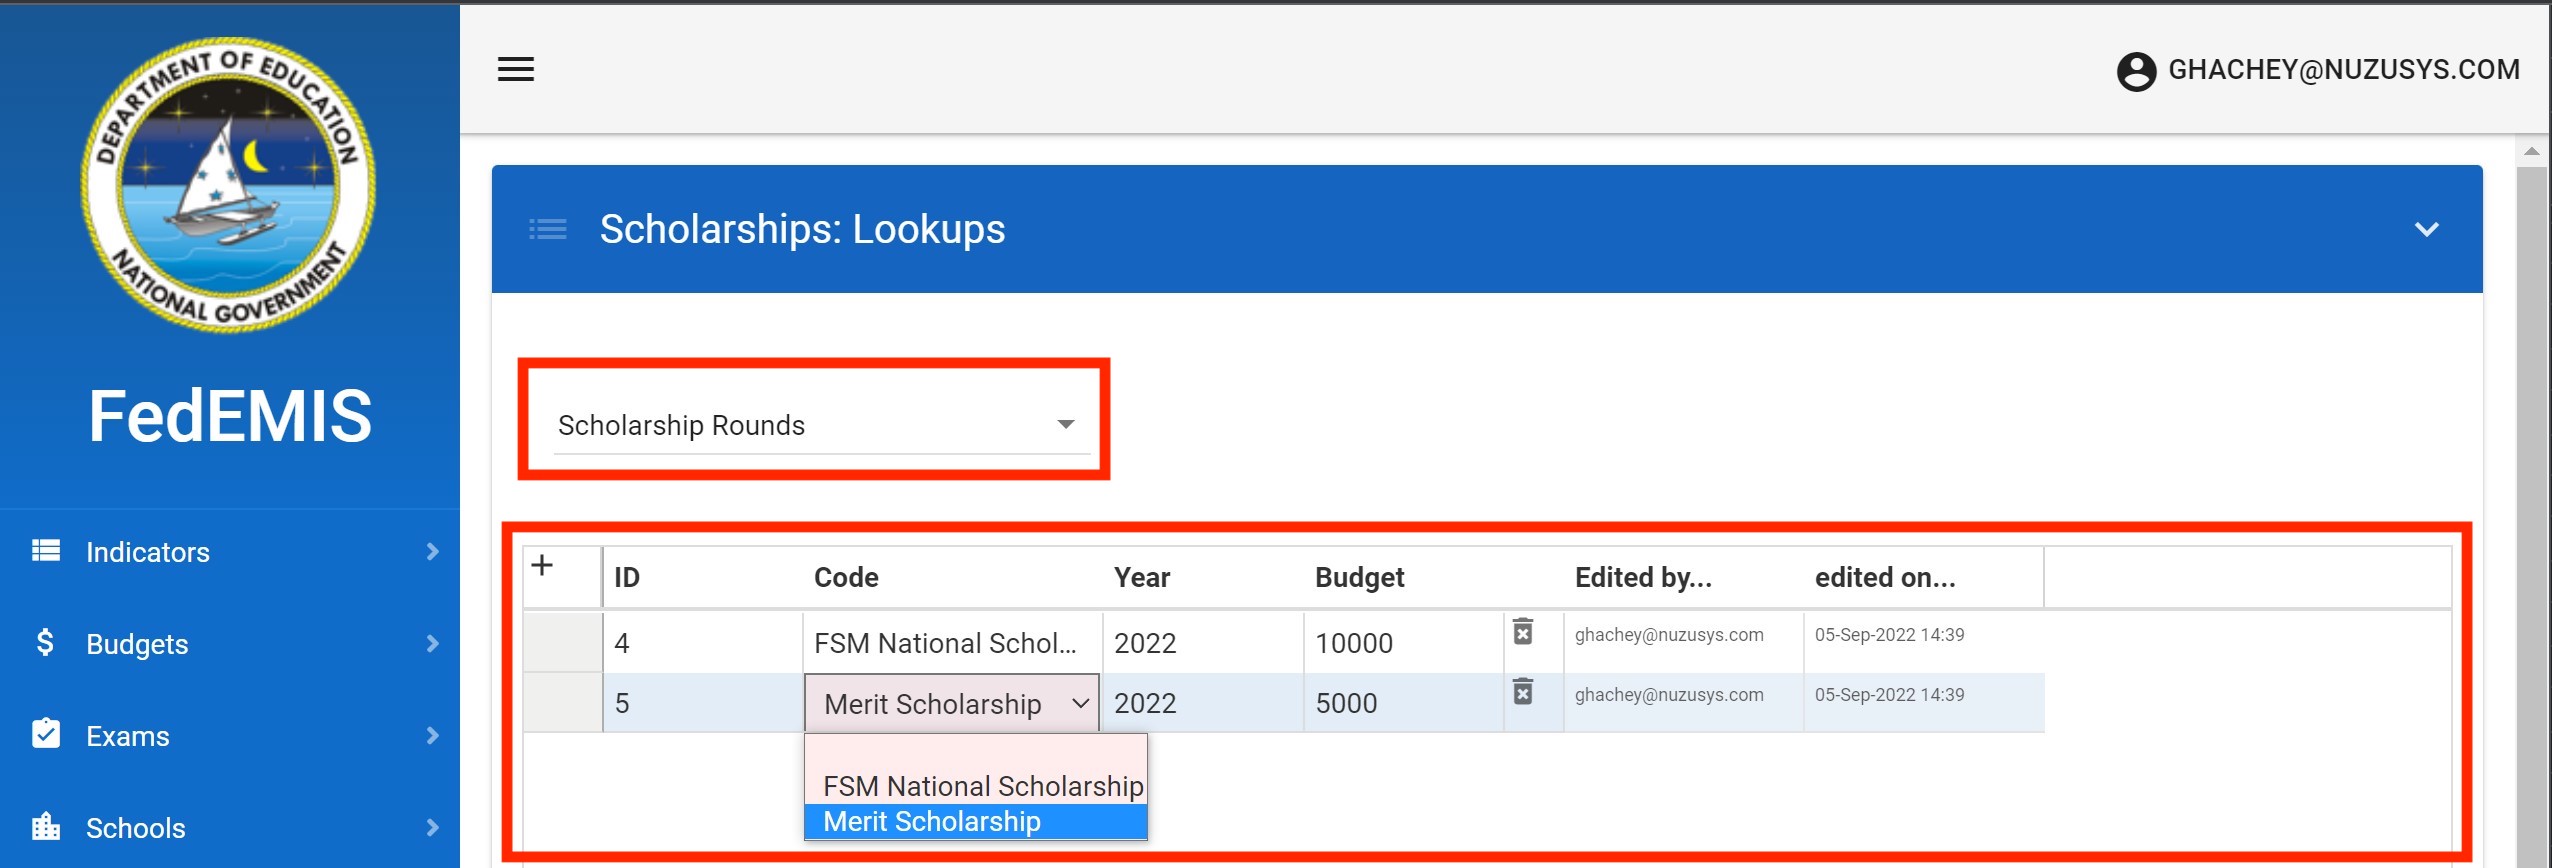
The scholarship rounds is an example of a configuration that needs to be done yearly. That is were you define the available scholarship budget for the year.
Adding Students
To add new students into the system you must follow a process typical of any data entry into a database. Scholarships are for students and you could have any of the following scenario for any student.
- Student scholarship exist: Student scholarship was already created in which you simply want to update some information
- Student record exist but no student scholarship yet: Student scholarship needs to be added and the EMIS already has a record of this student from his school years records.
- Student record and student scholarship both do not exist: Student scholarship needs to be added but for some reason the EMIS does not already contain a student record for this student.
Therefore, the process should follow the order above.
Student scholarship exist
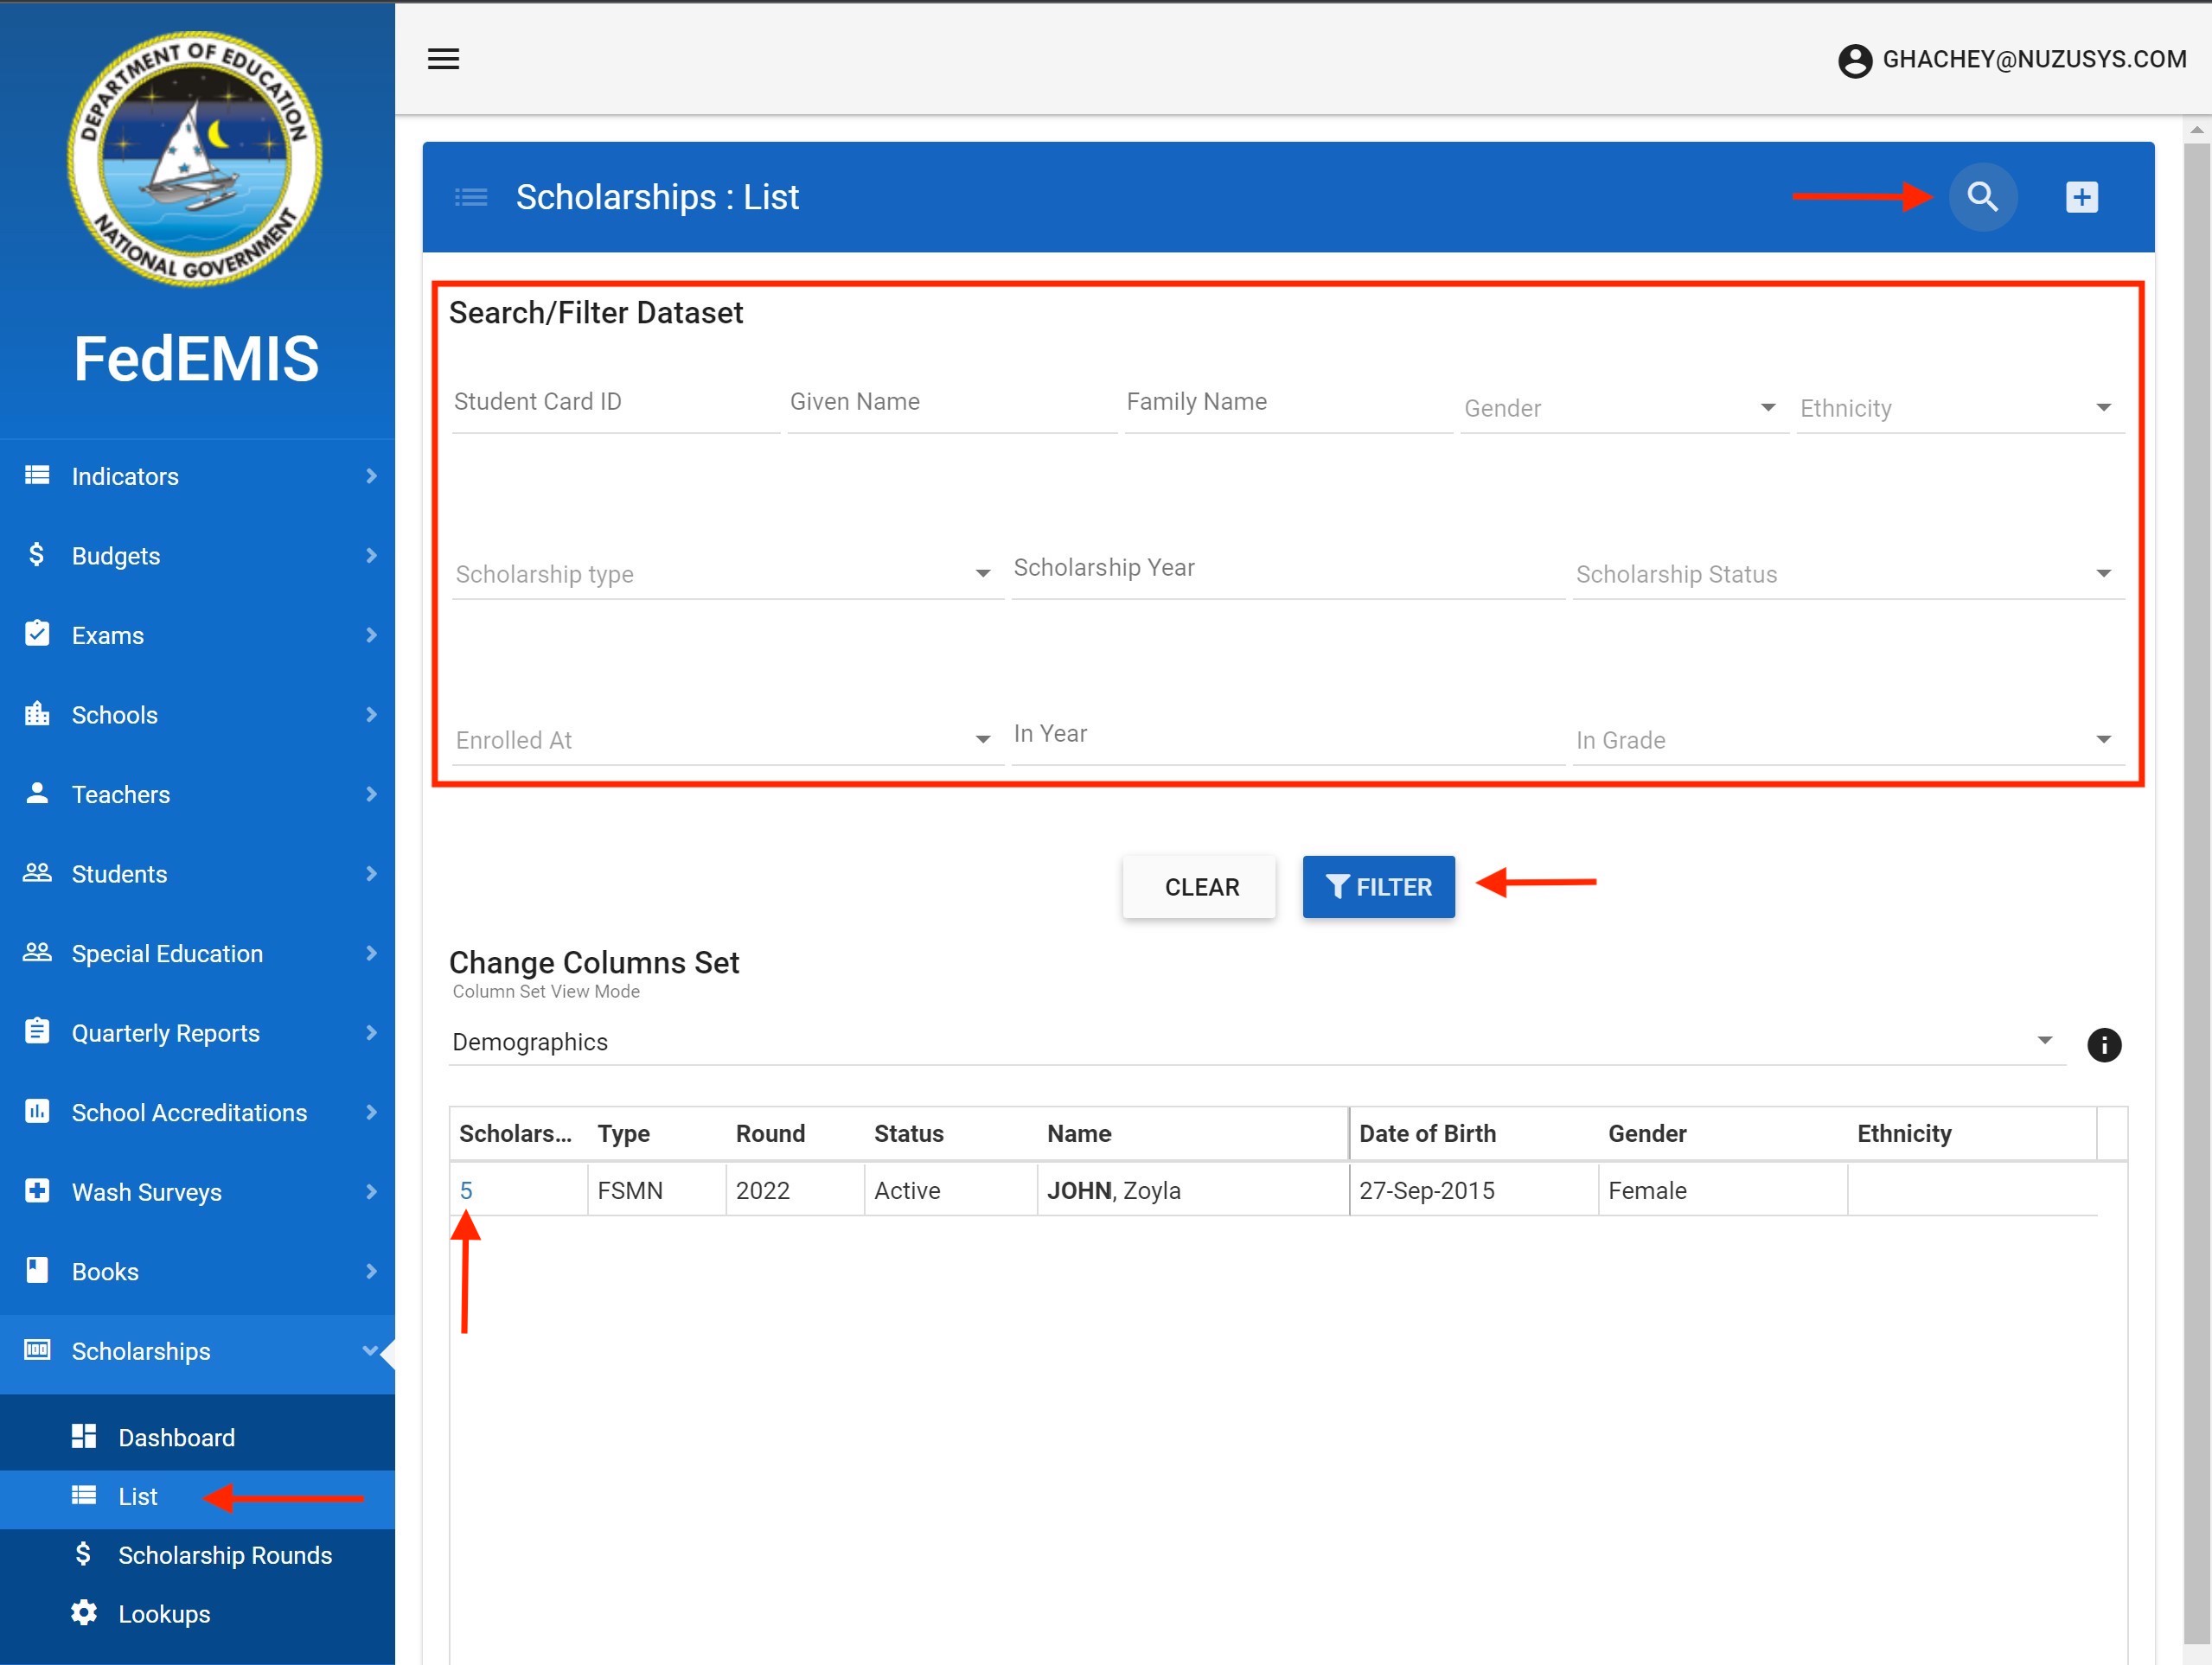
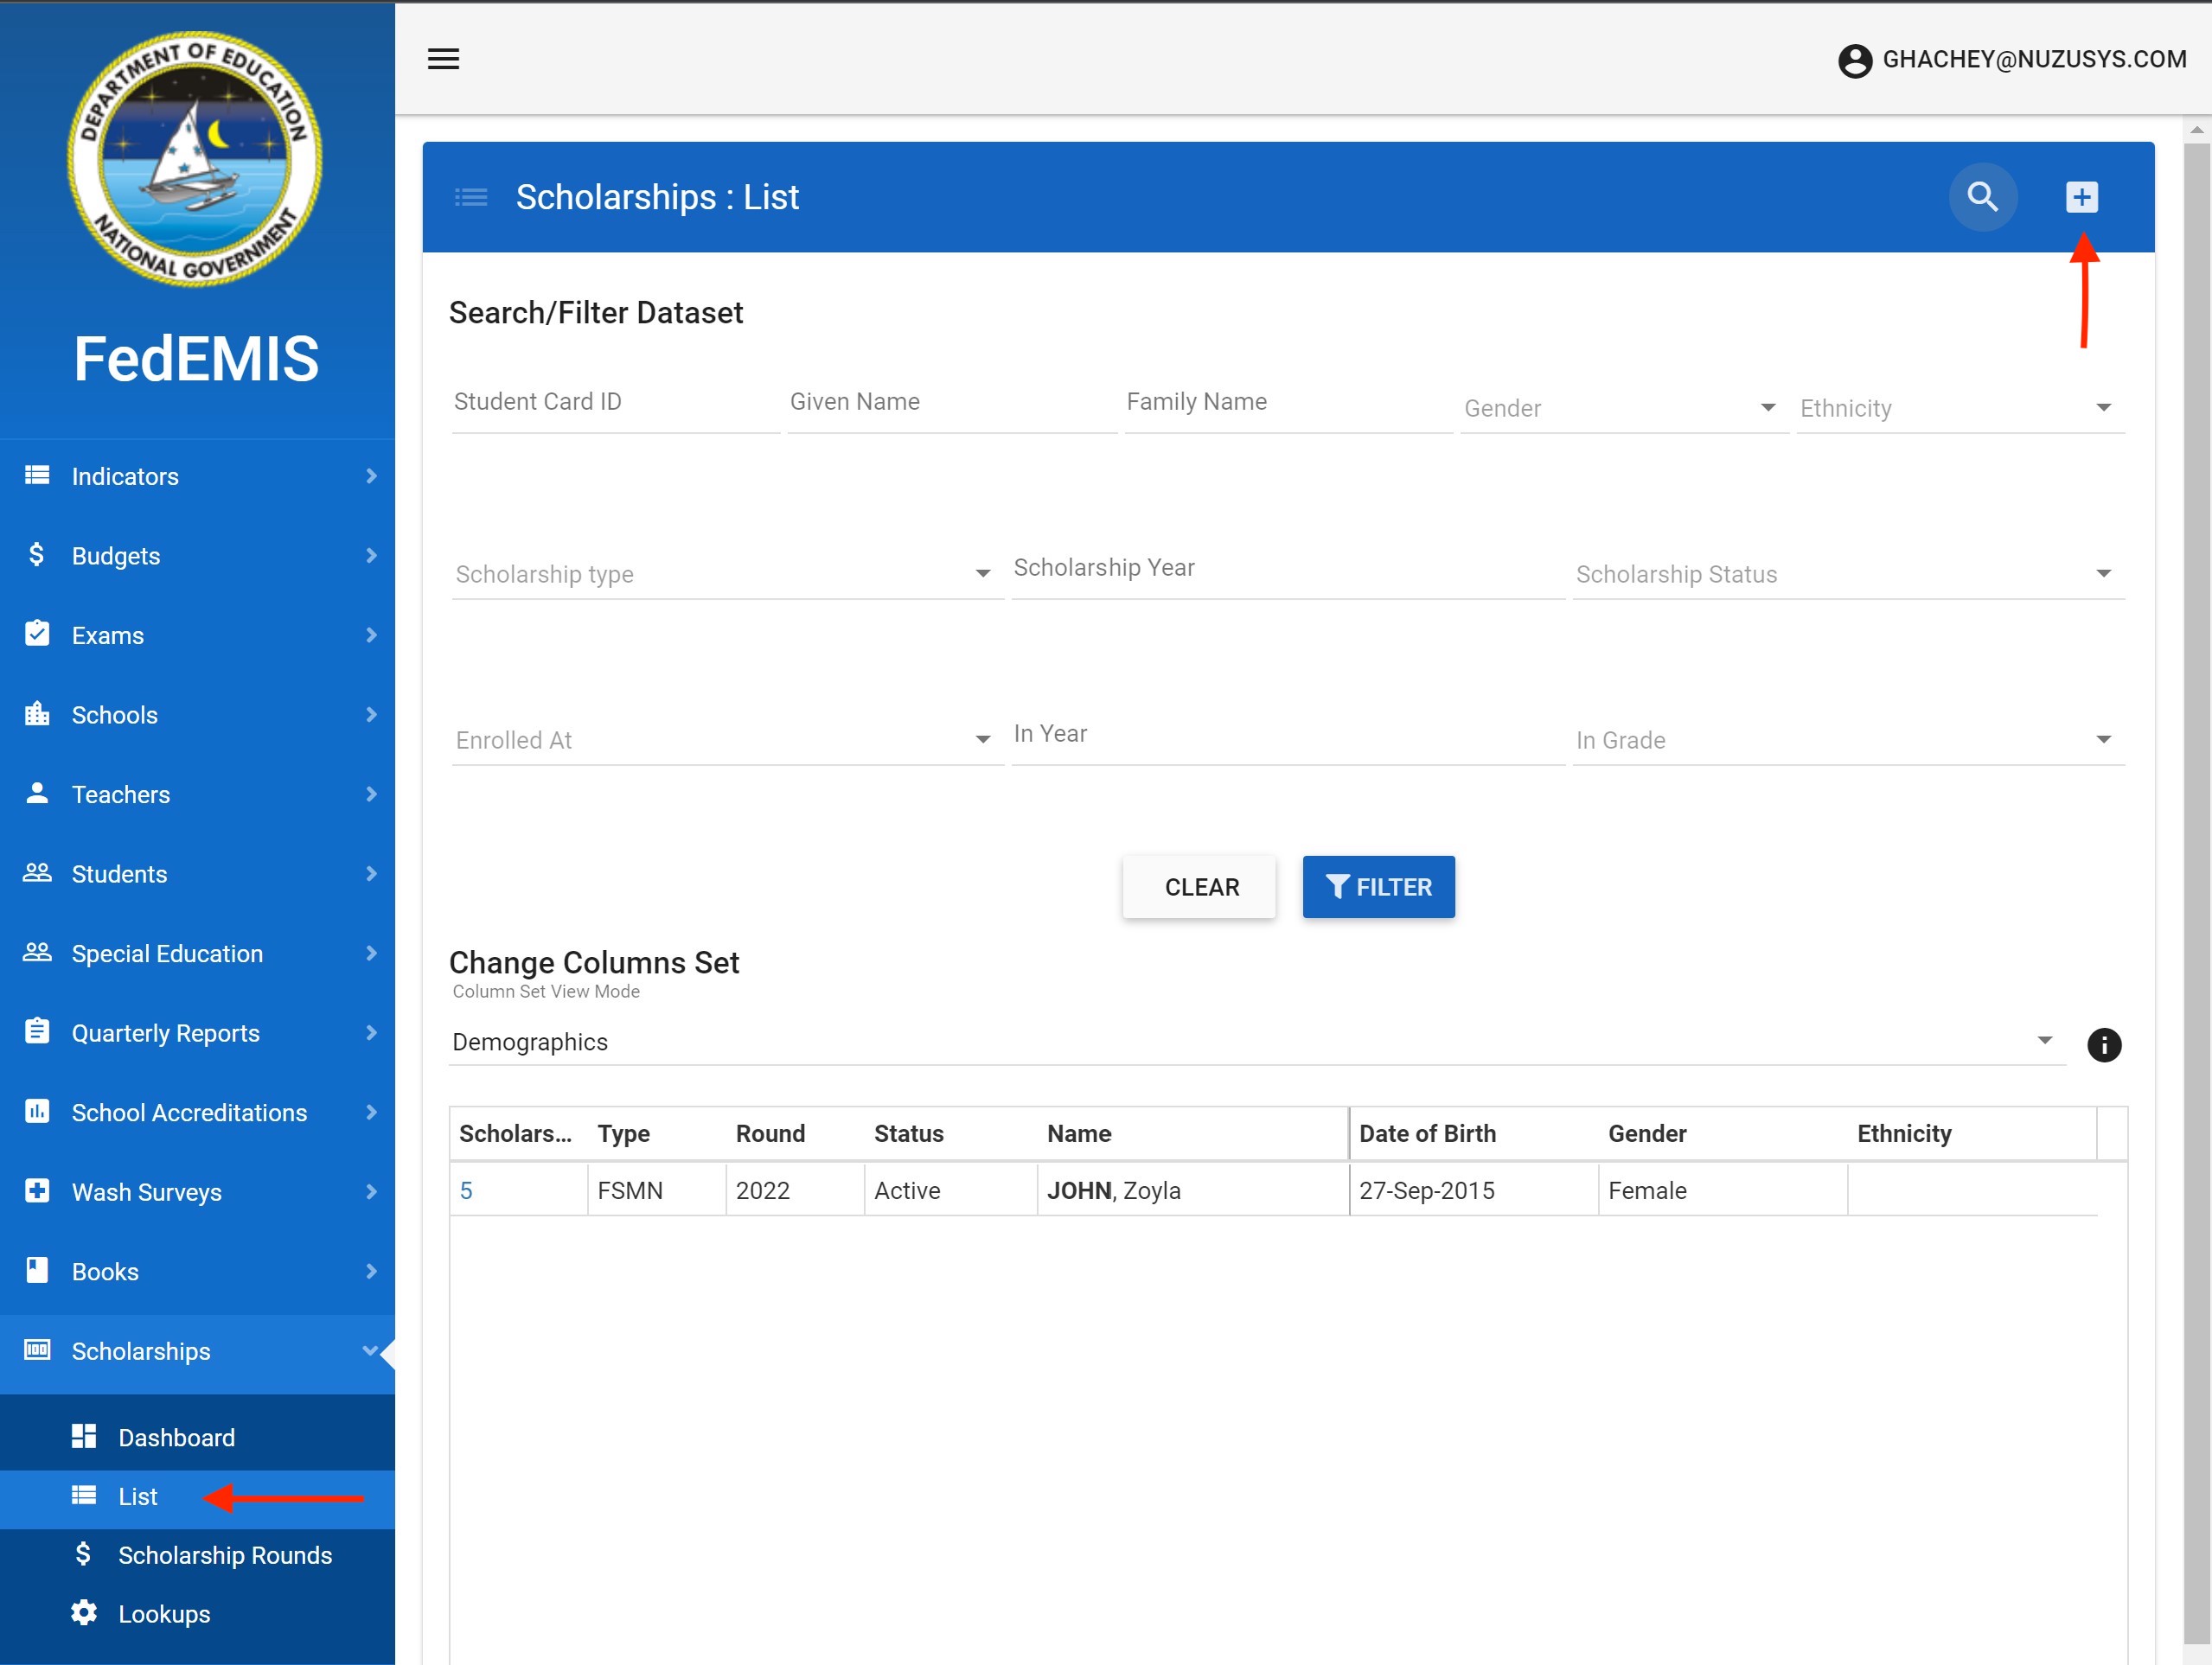
First look for whether the student is already the scholarship database. For this you can to Scholarships → List. Click on the magnifying glass to access the search filter dataset fields. Search for the student of interest and click on Filter. If found you can simply open the record and update it. For example, say you student of interest is John Zoyla, click on the number of John Zoyla to the left of the record as shown below.
Student record exist but no student scholarship yet
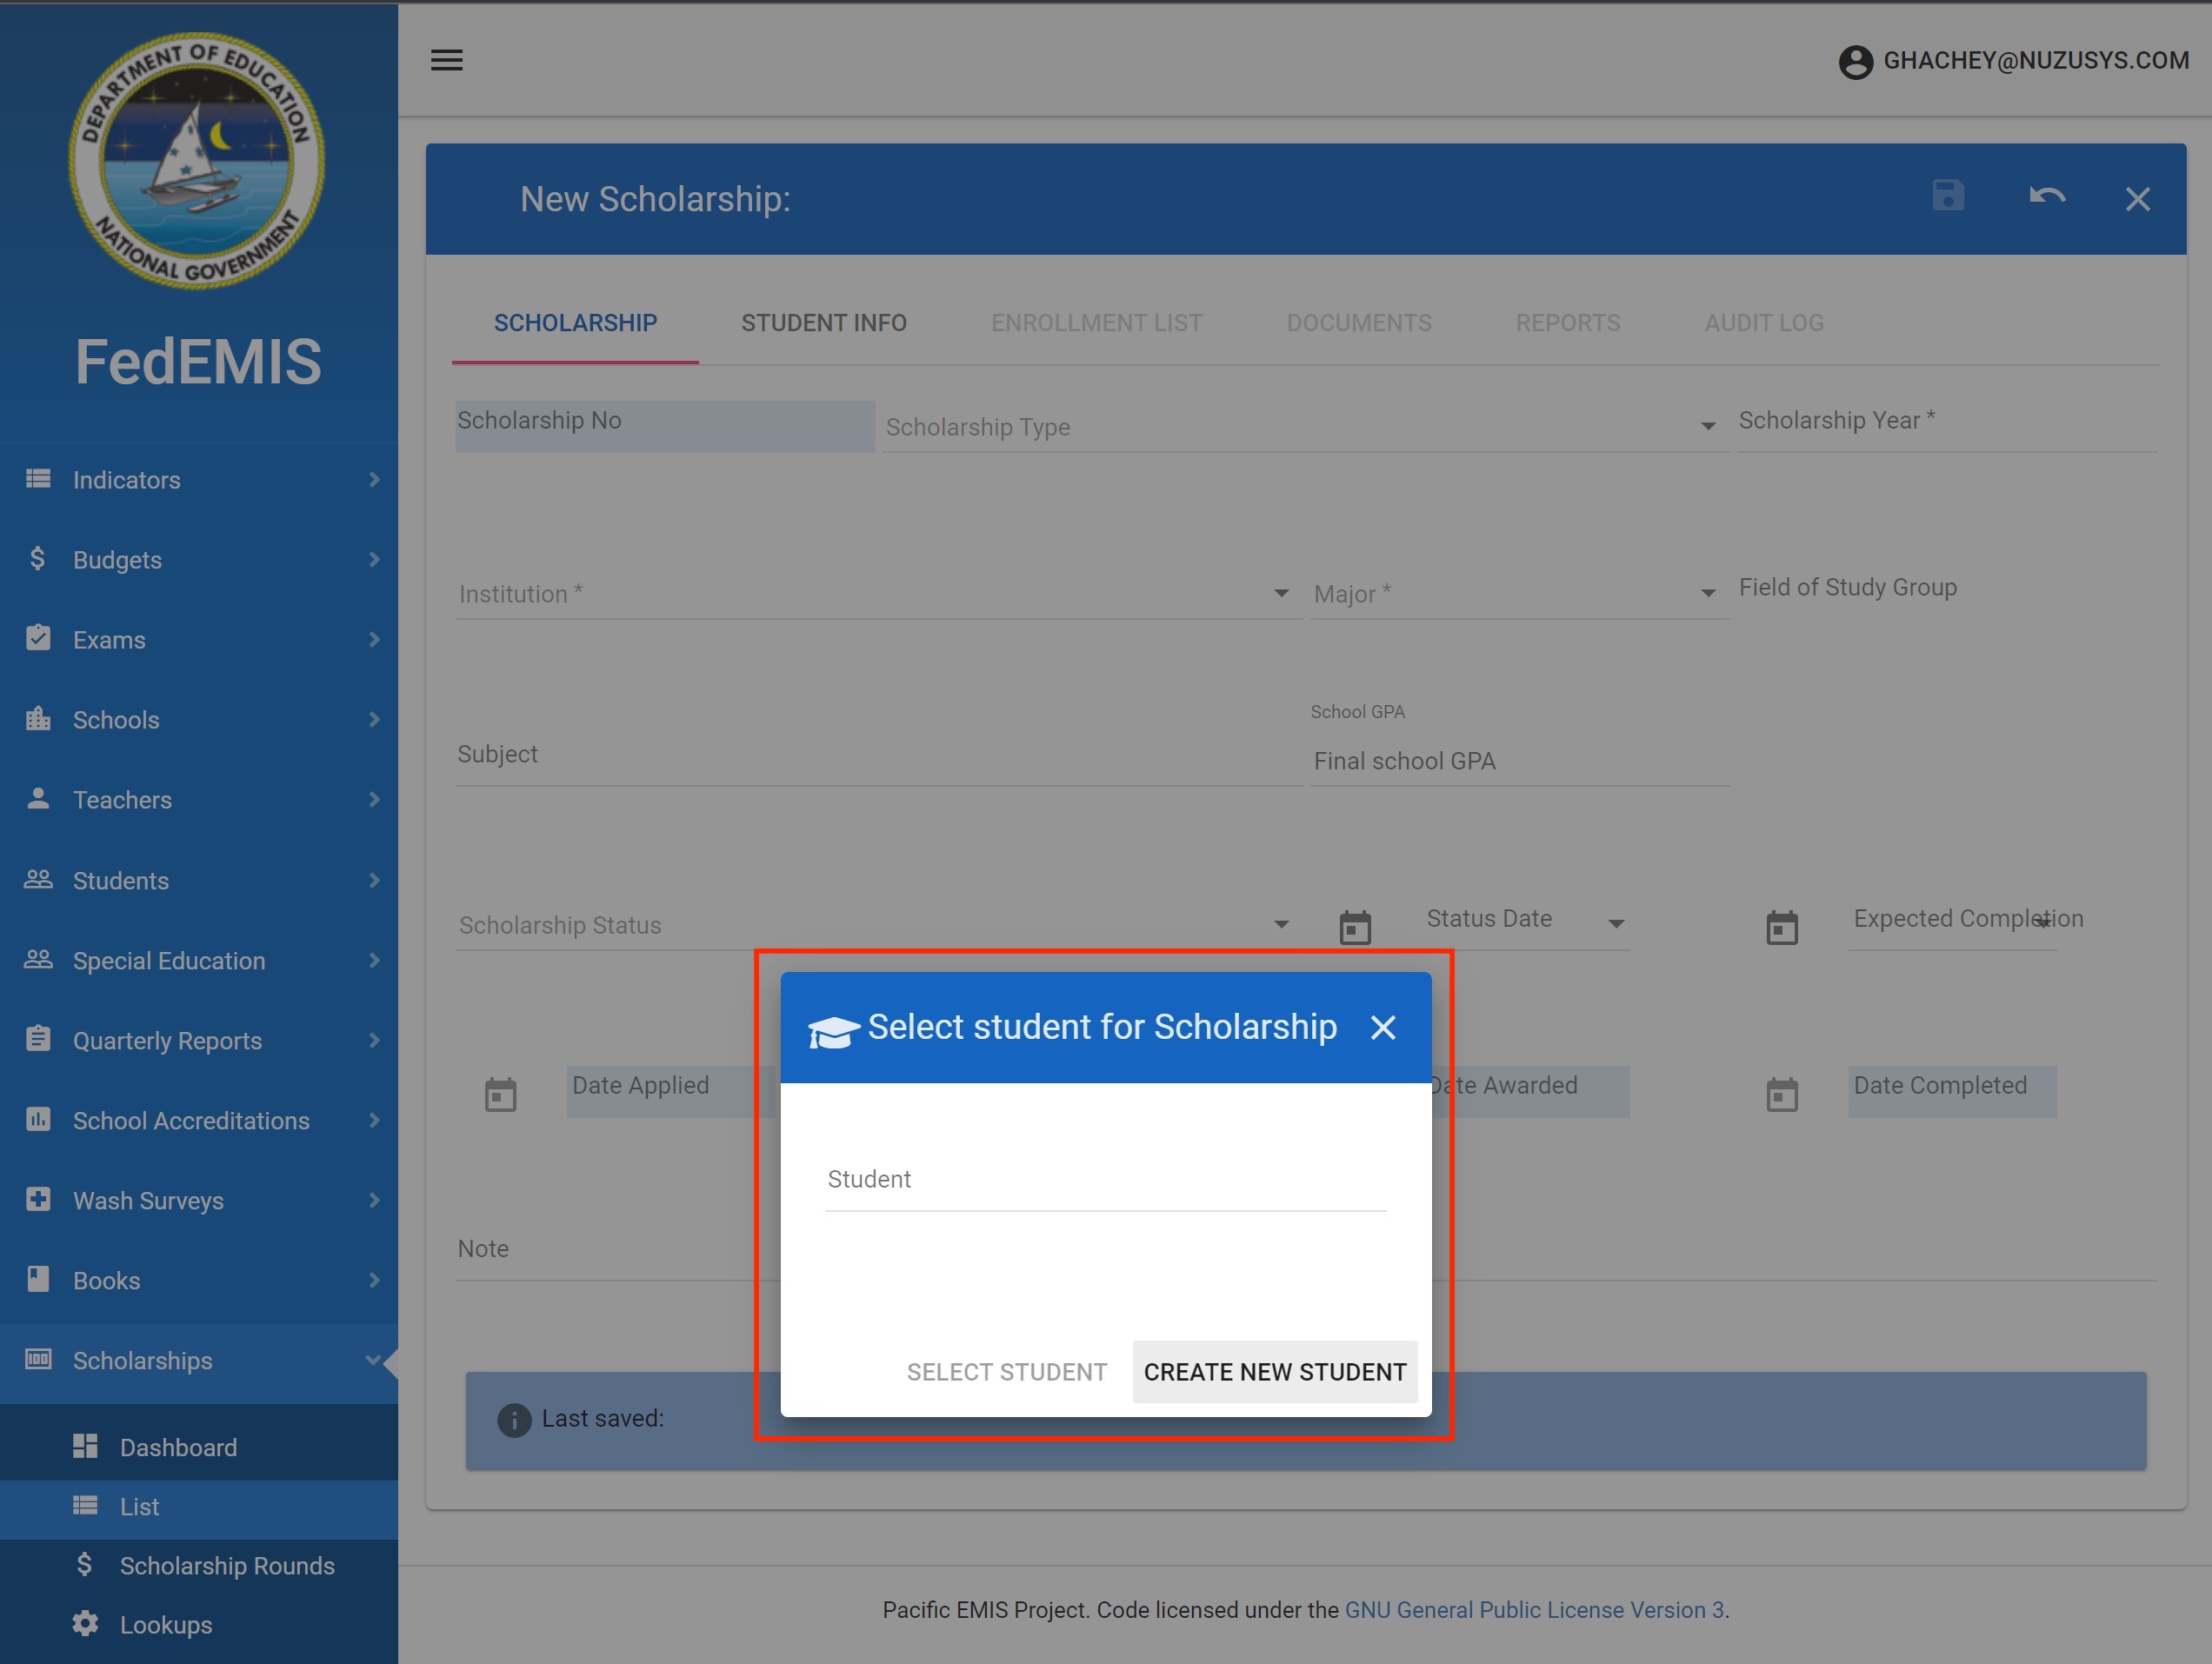
Second, if it not found in the scholarship database you can then proceed to add it as shown below.
At this point you will be presented with a prompt that looks like the following.
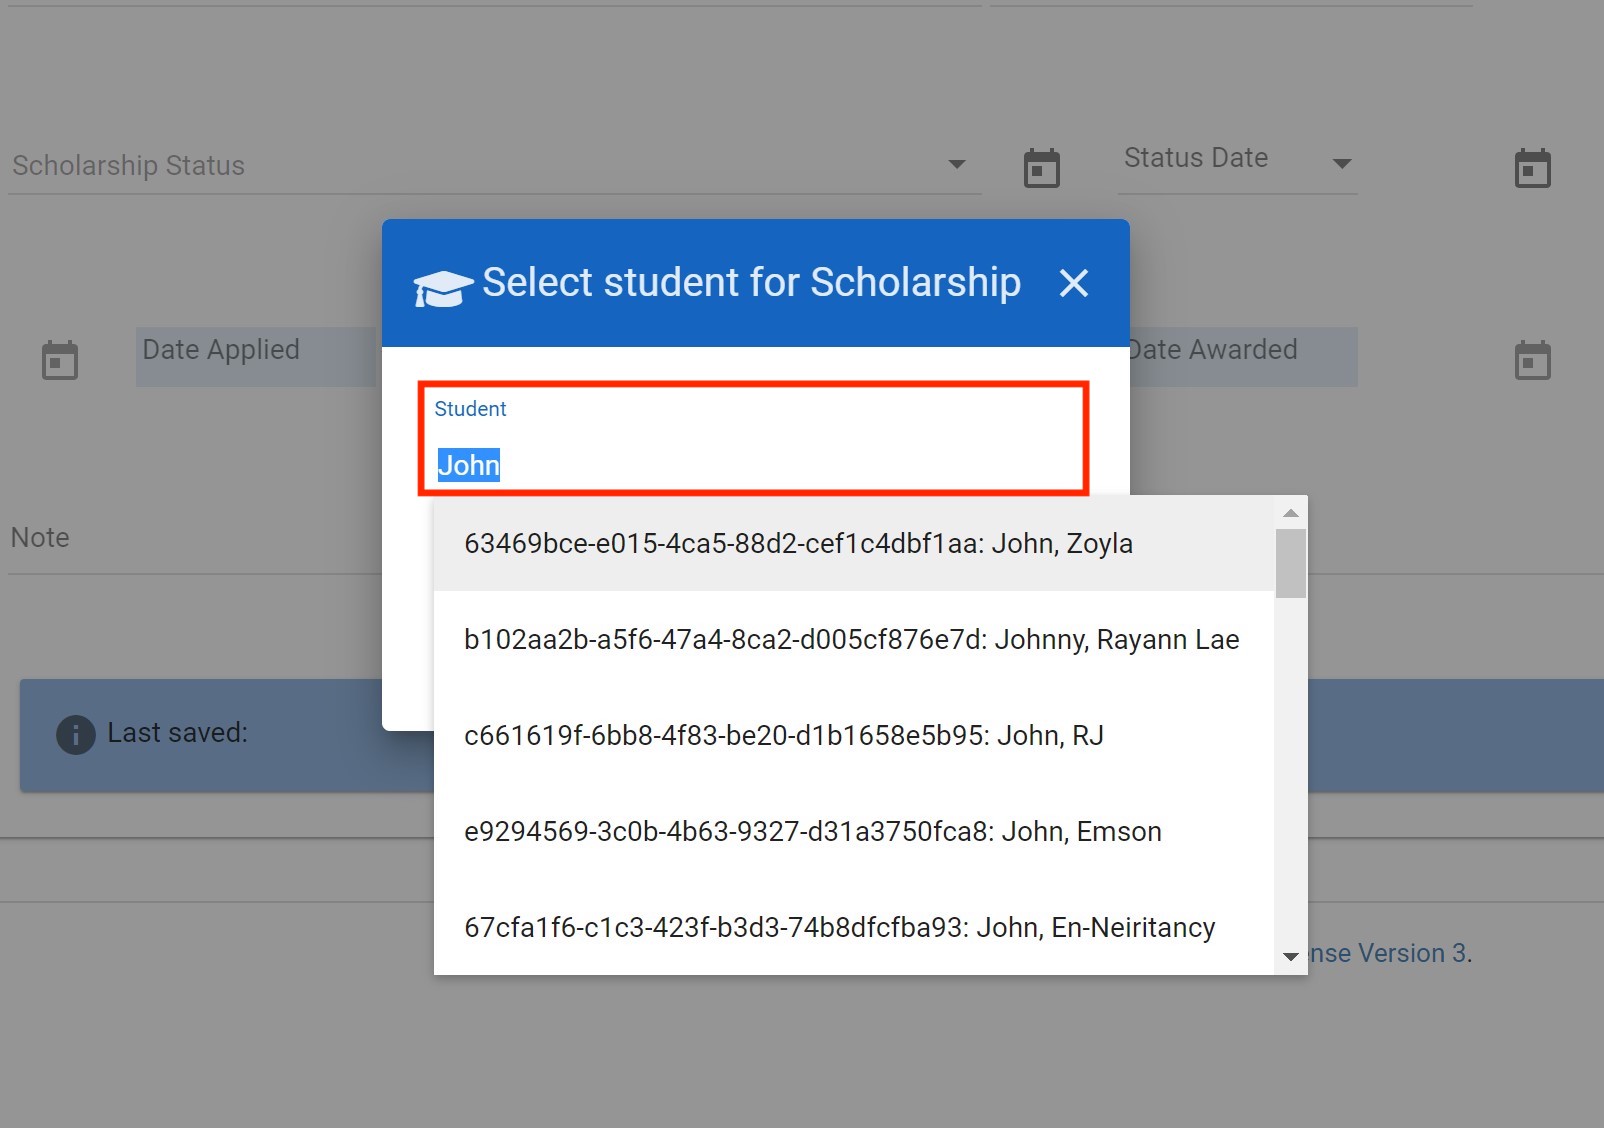
You can start typing the name of the student of interest. Some choices that closely match your student will automatically be listed in a dropdown as shown below.
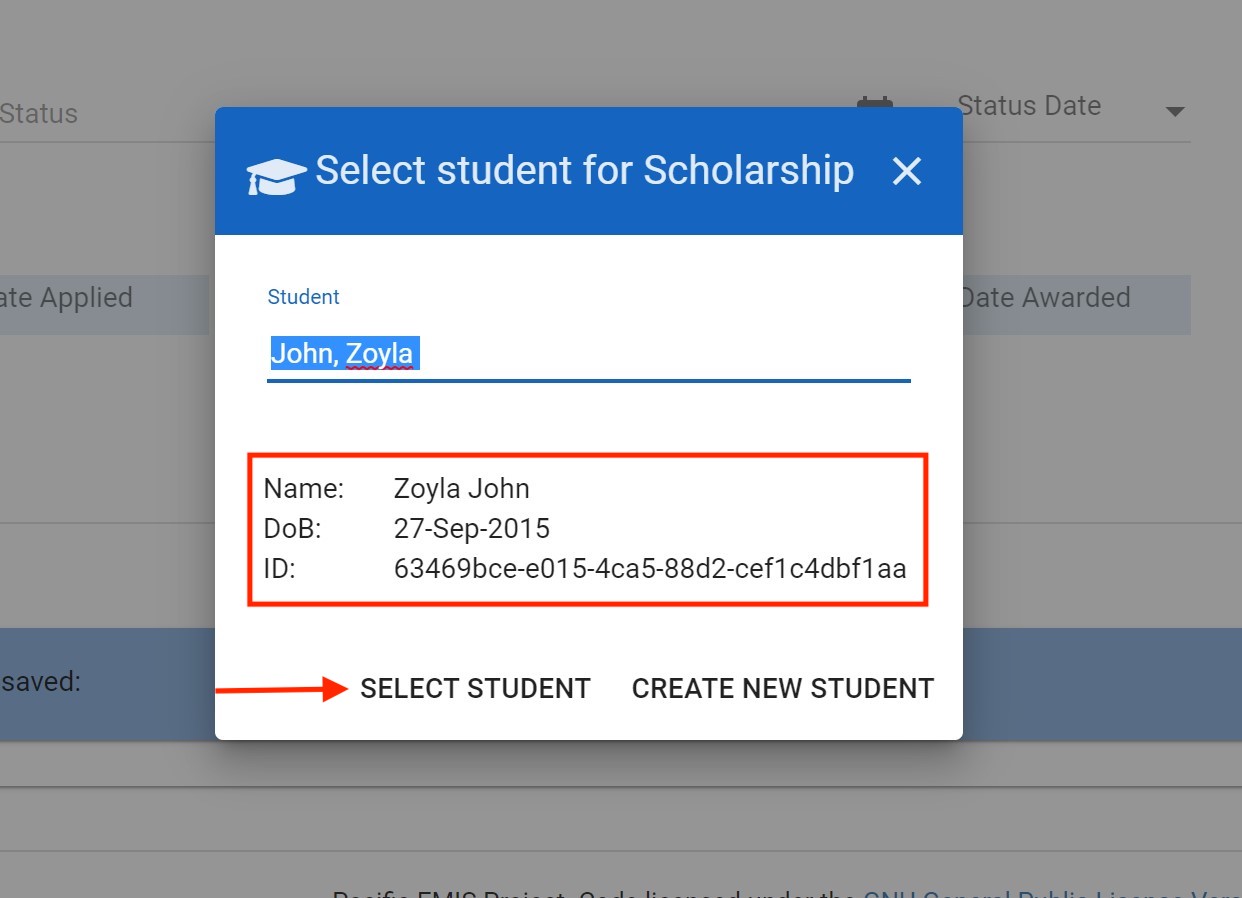
If your student of interest is listed this means there is already a student record in the EMIS and there is no need to create a new one, you can just click on Select Student to proceed to create a scholarship for that known student. You will see the following. First confirm it is the same student with a quick date of birth check.
Student record and student scholarship both do not exist
Third, if the search for the student above did not turn out any results chances are the student does not have a record from his school year in the EMIS. This is last resort and less likely as there should be a student record from school years. This scenario could happen for a student that was entered as a different name (changed name), just arrived in the country or some other rare cases. An empty search would look like the below with no dropdown student listed. When there is no student found you can just go ahead and Create New Student.

This should come up. The only real difference with Create New Student and the Select Student seen above is that you would also need to put in all the student details as shown in the second image below.
Managing Student Scholarship
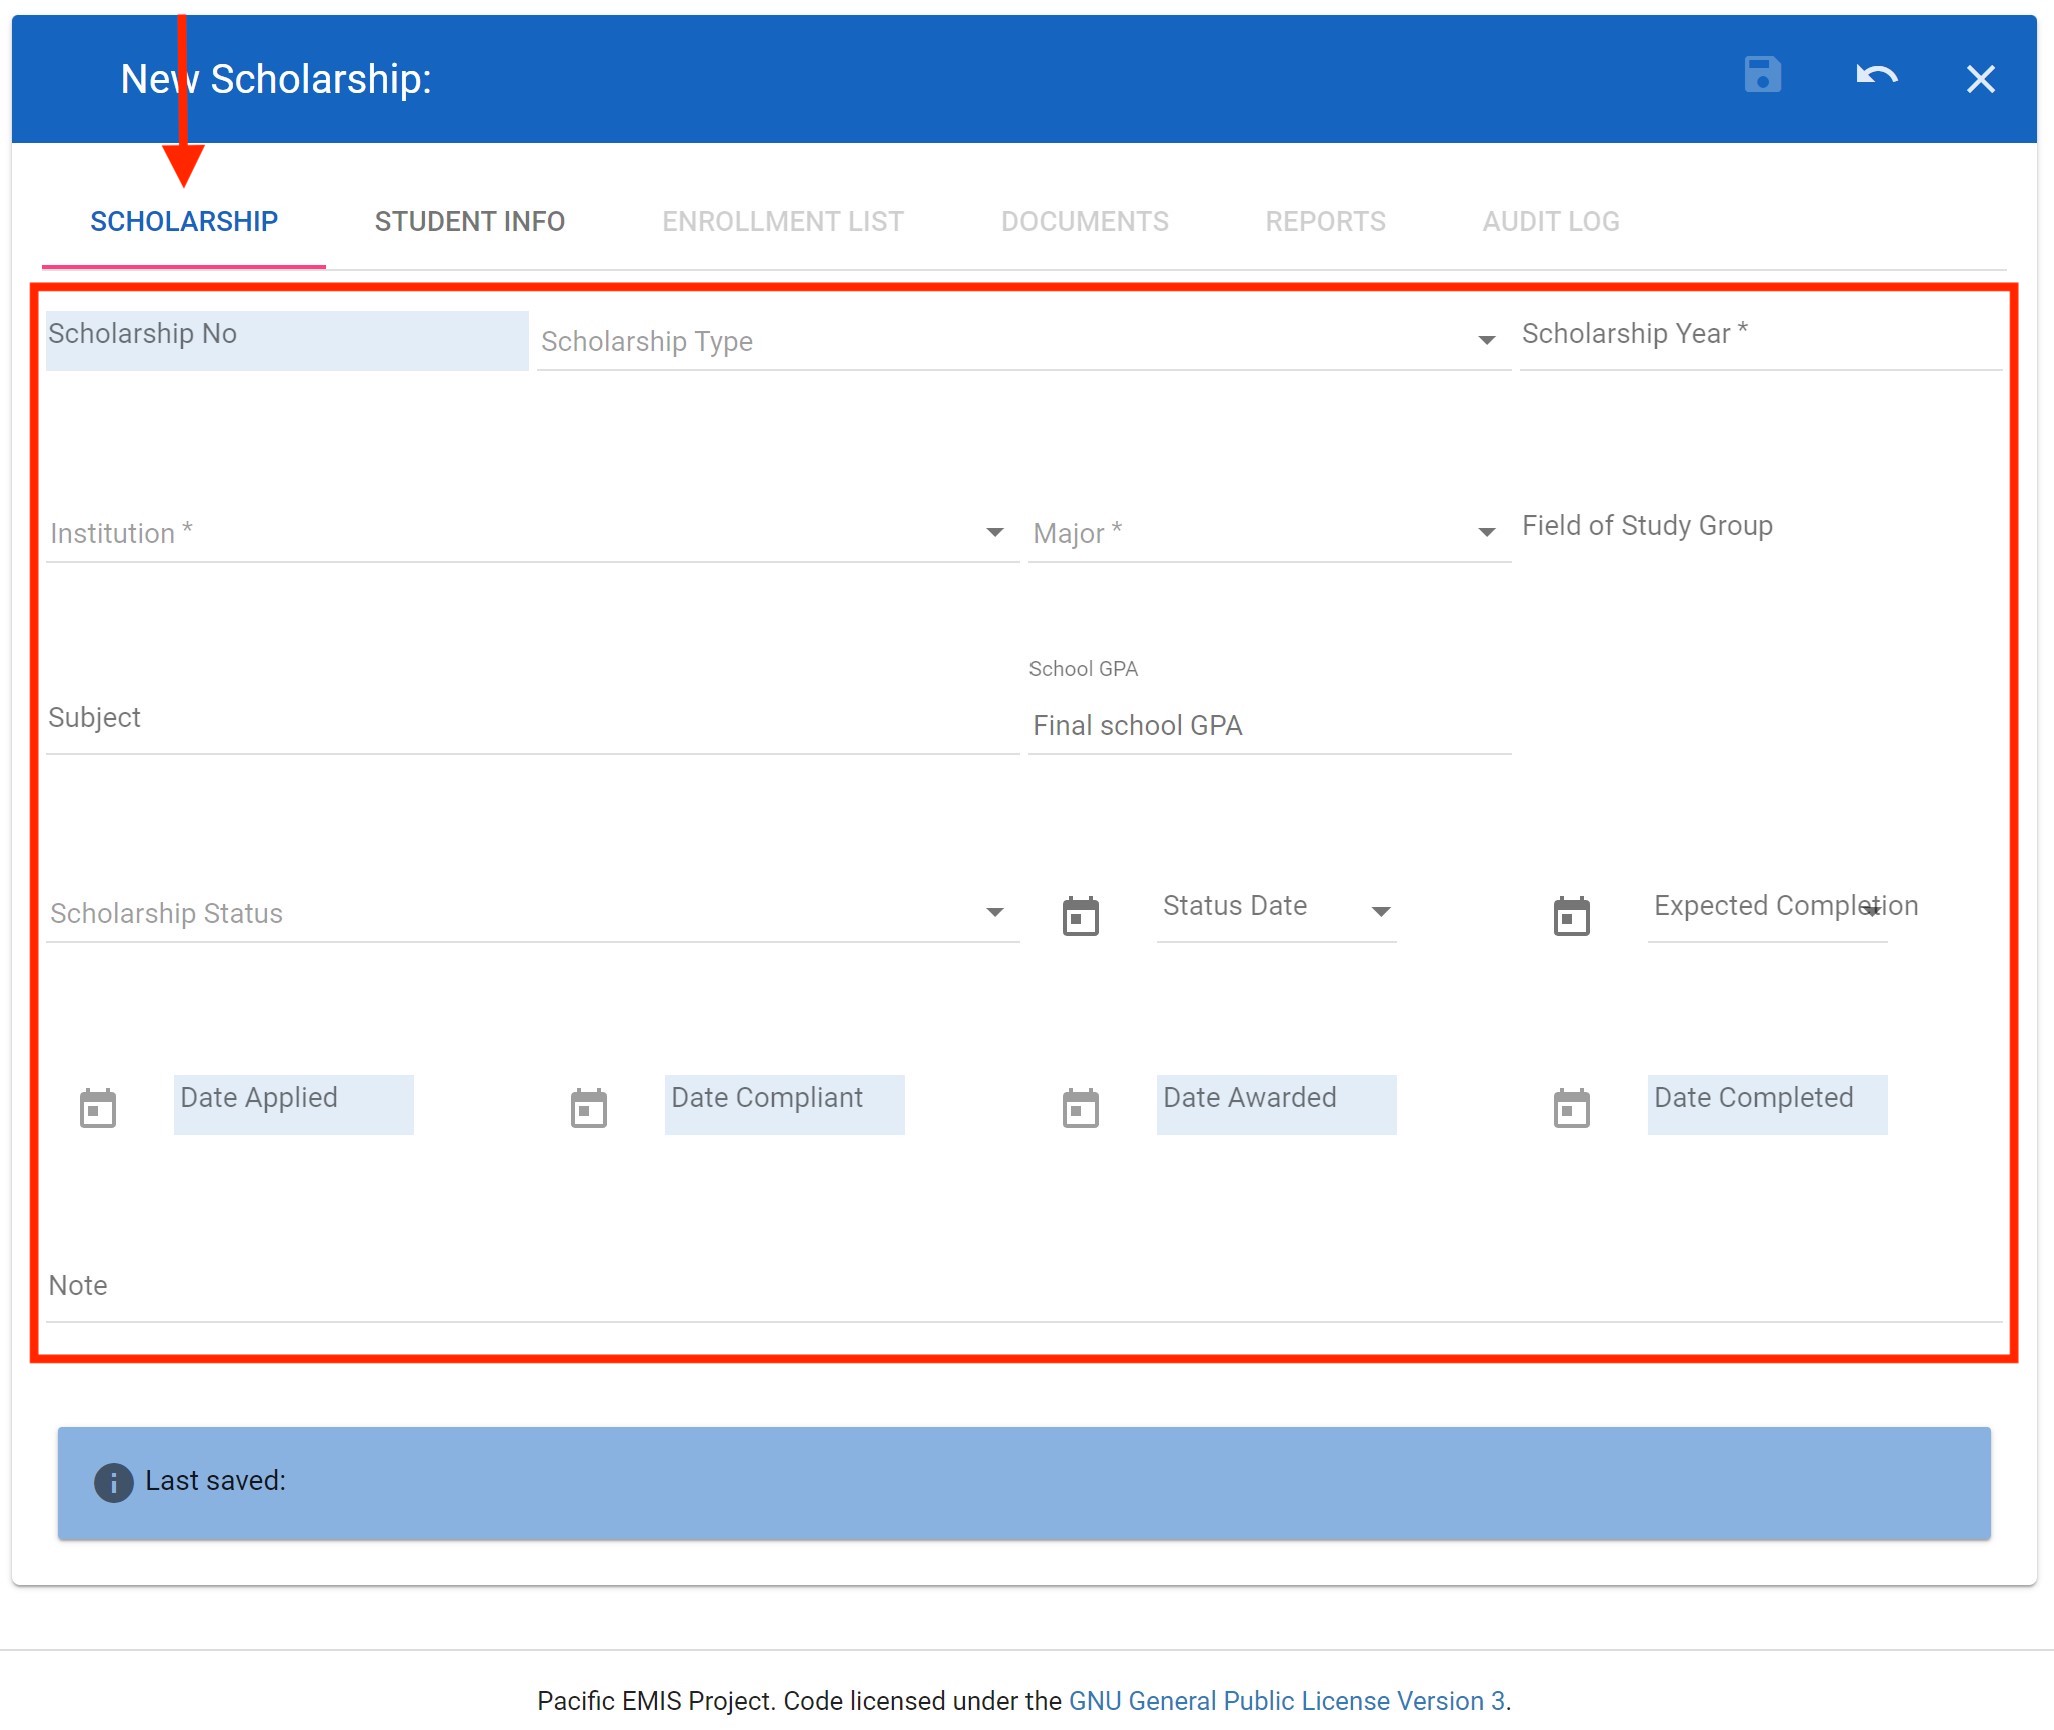
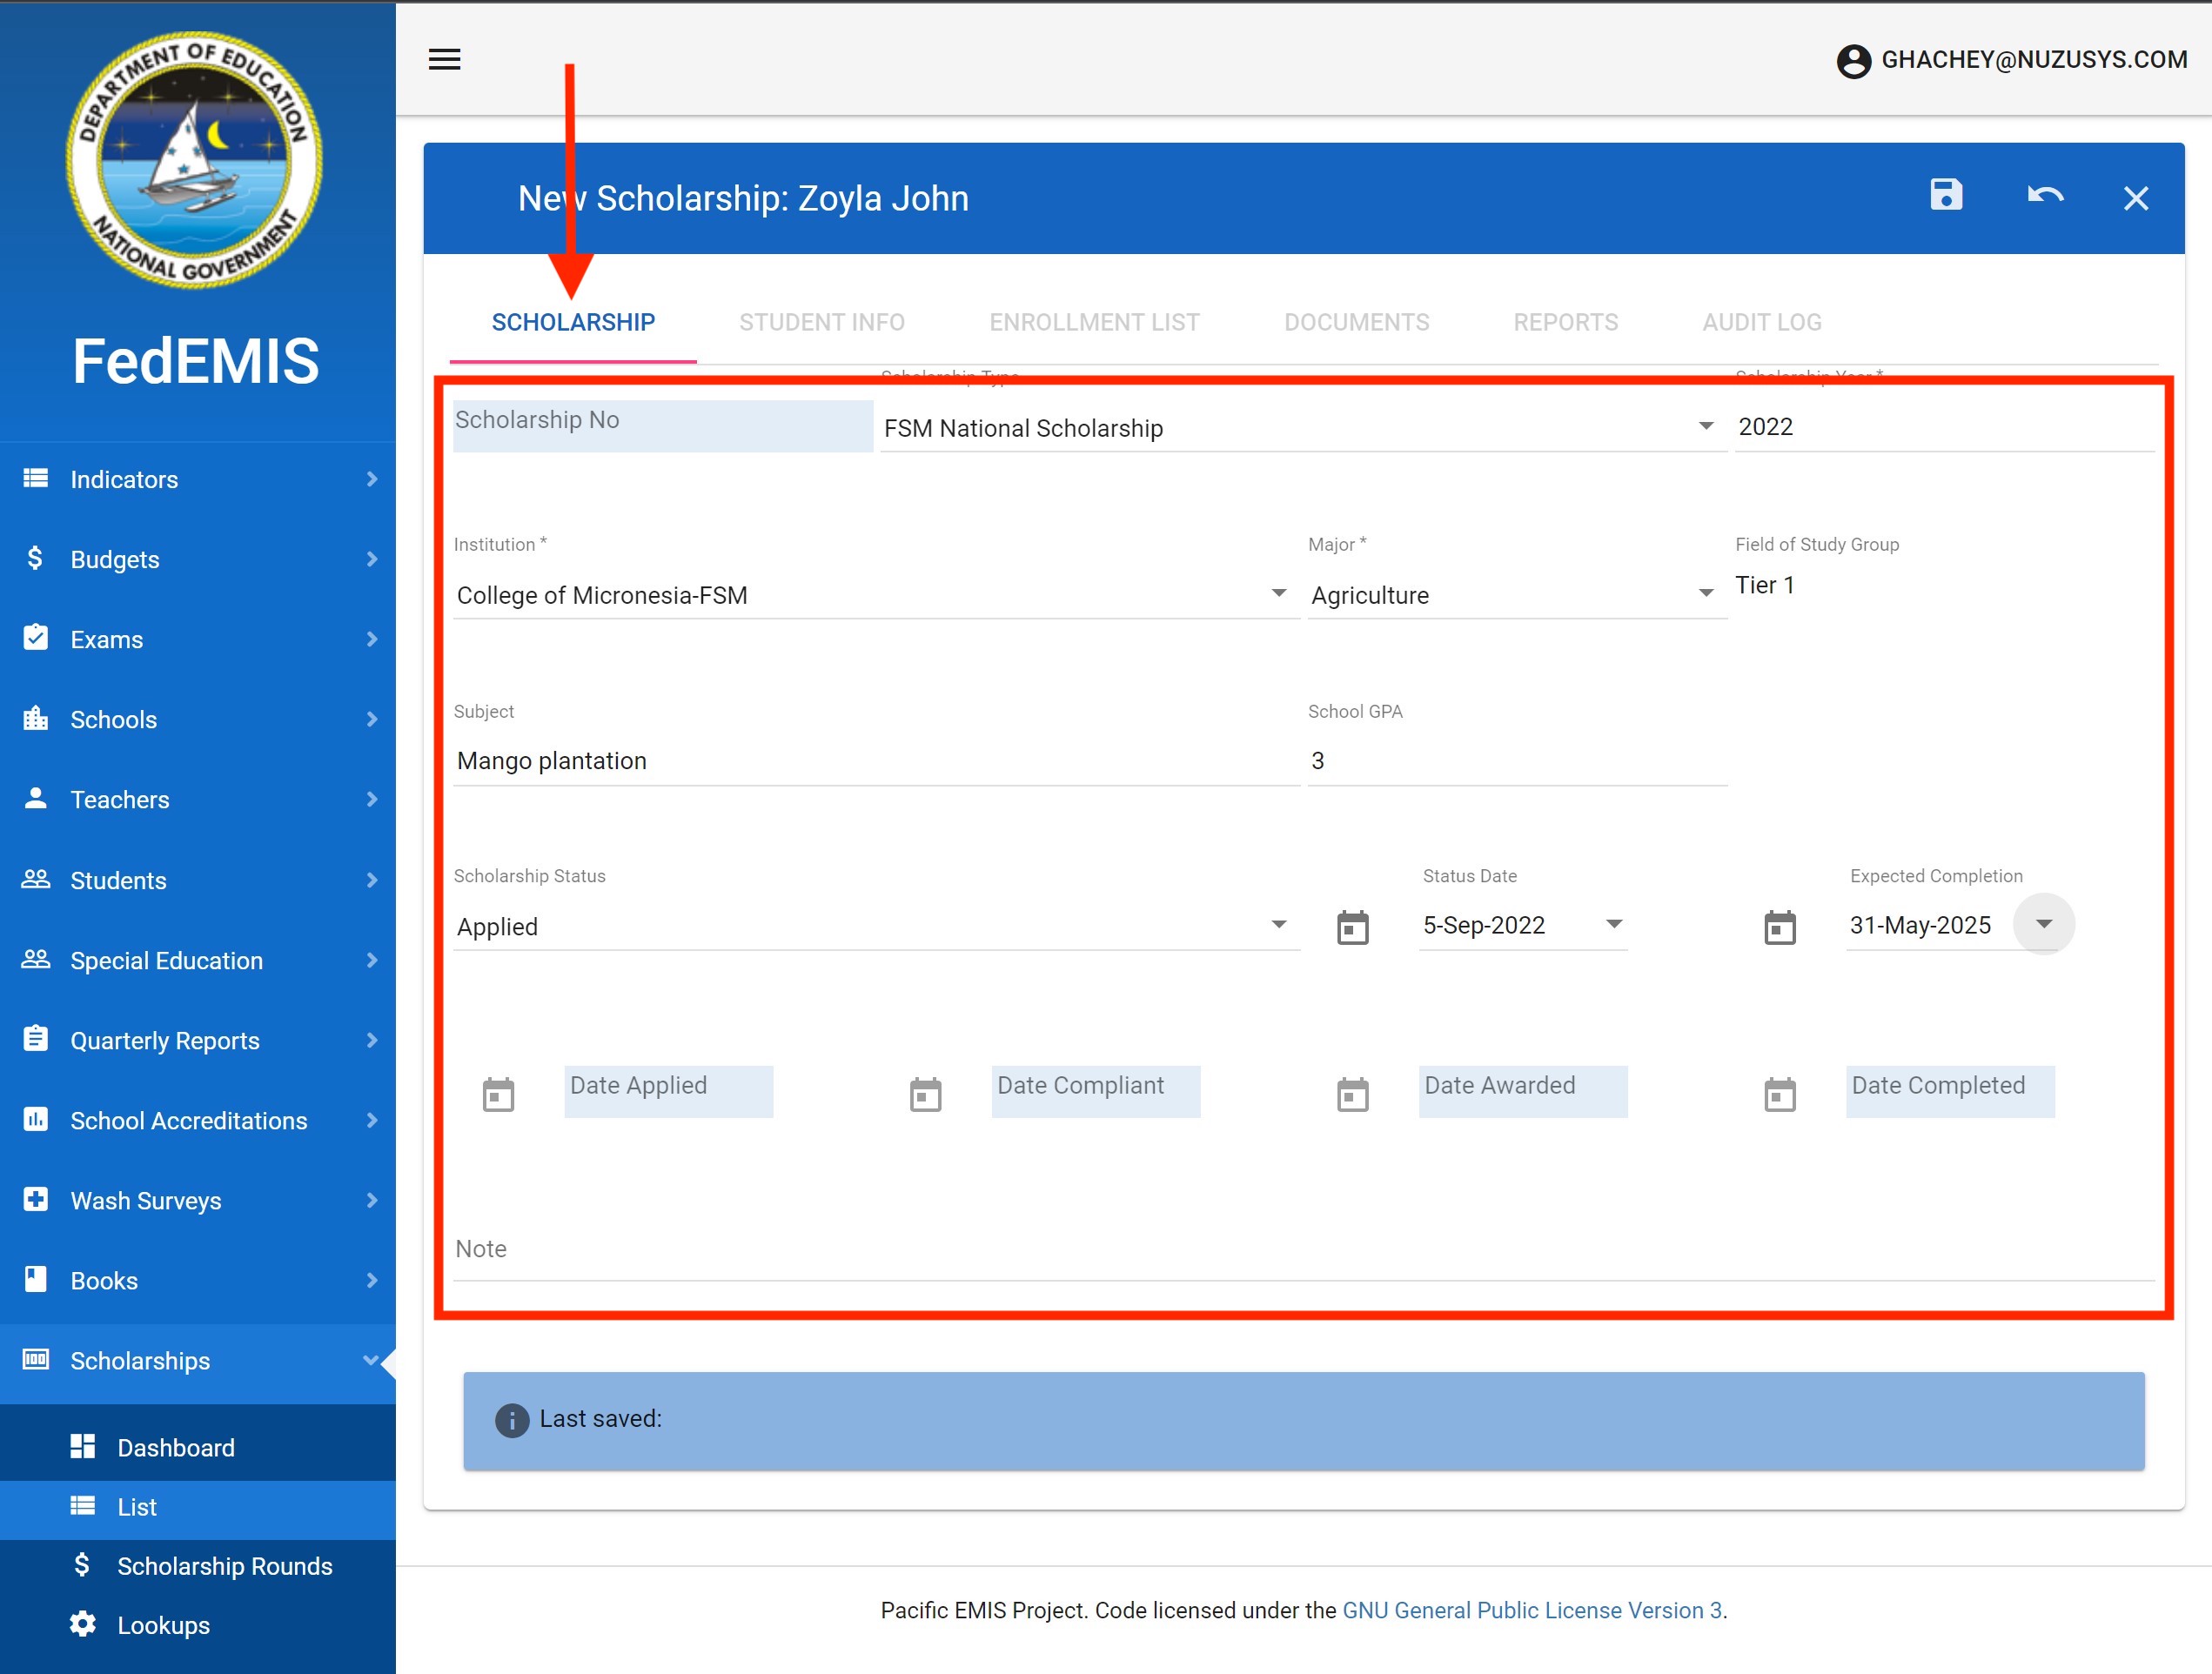
Regardless of how the student scholarship was added in the previous section from now on everything is the same. You first need to add all the known scholarship data as shown in the following. Typically, the first known data is the Scholarship Type, Scholarship Year, Institution, Major, Field of Study, Subject, School GPA, etc. And the first Scholarship Status could be Applied along with the Status Date.
Scholarship Status and the Status Date should normally be changed together as the date indicates the date at which the status changed.
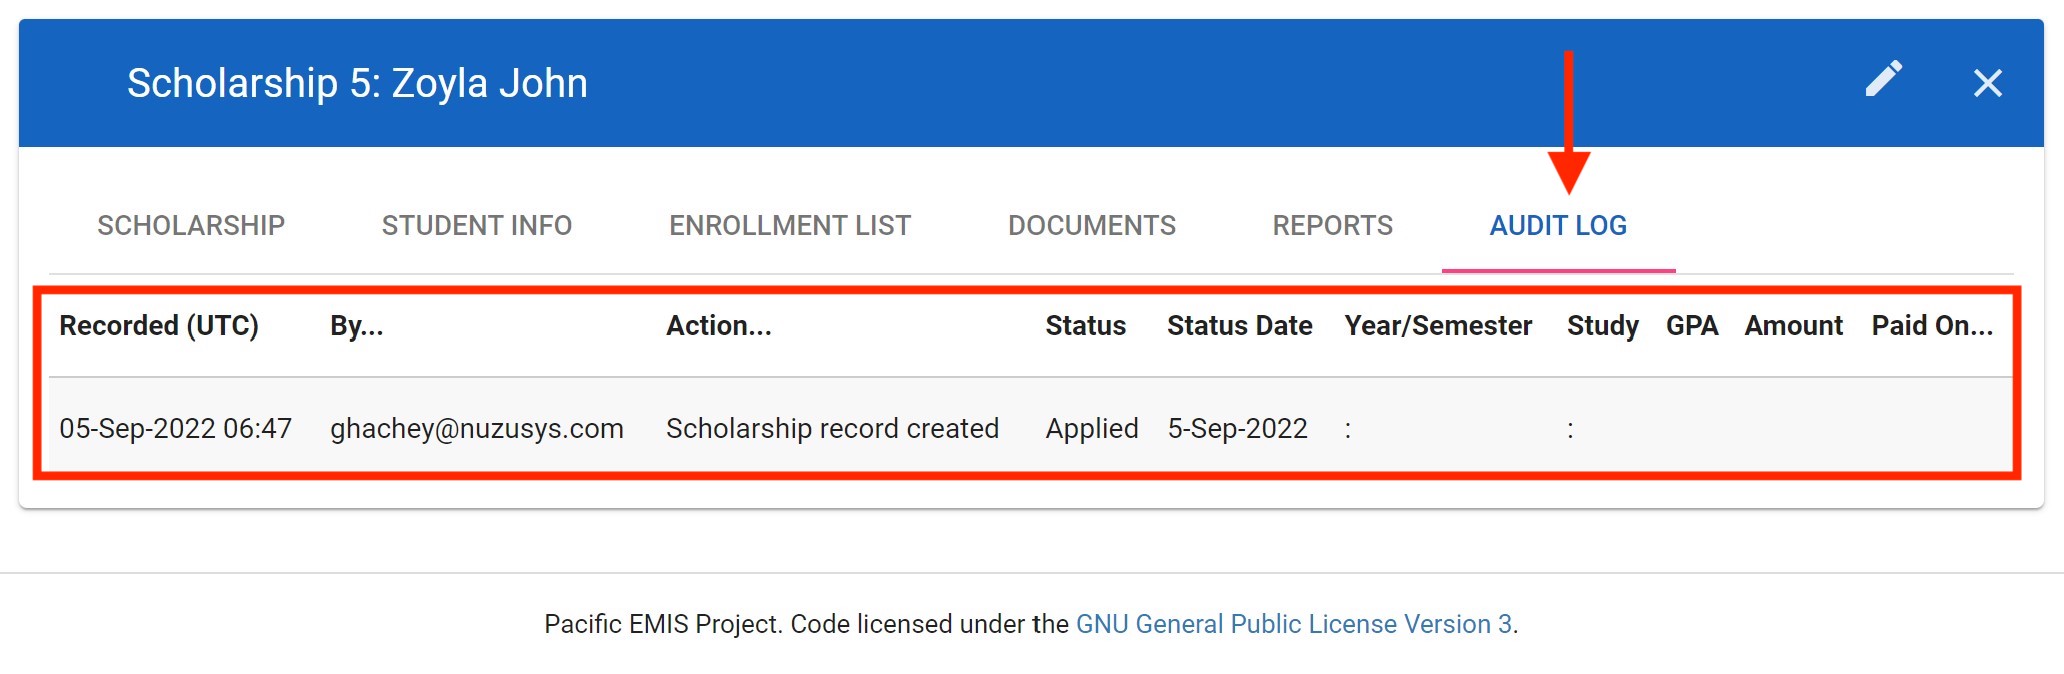
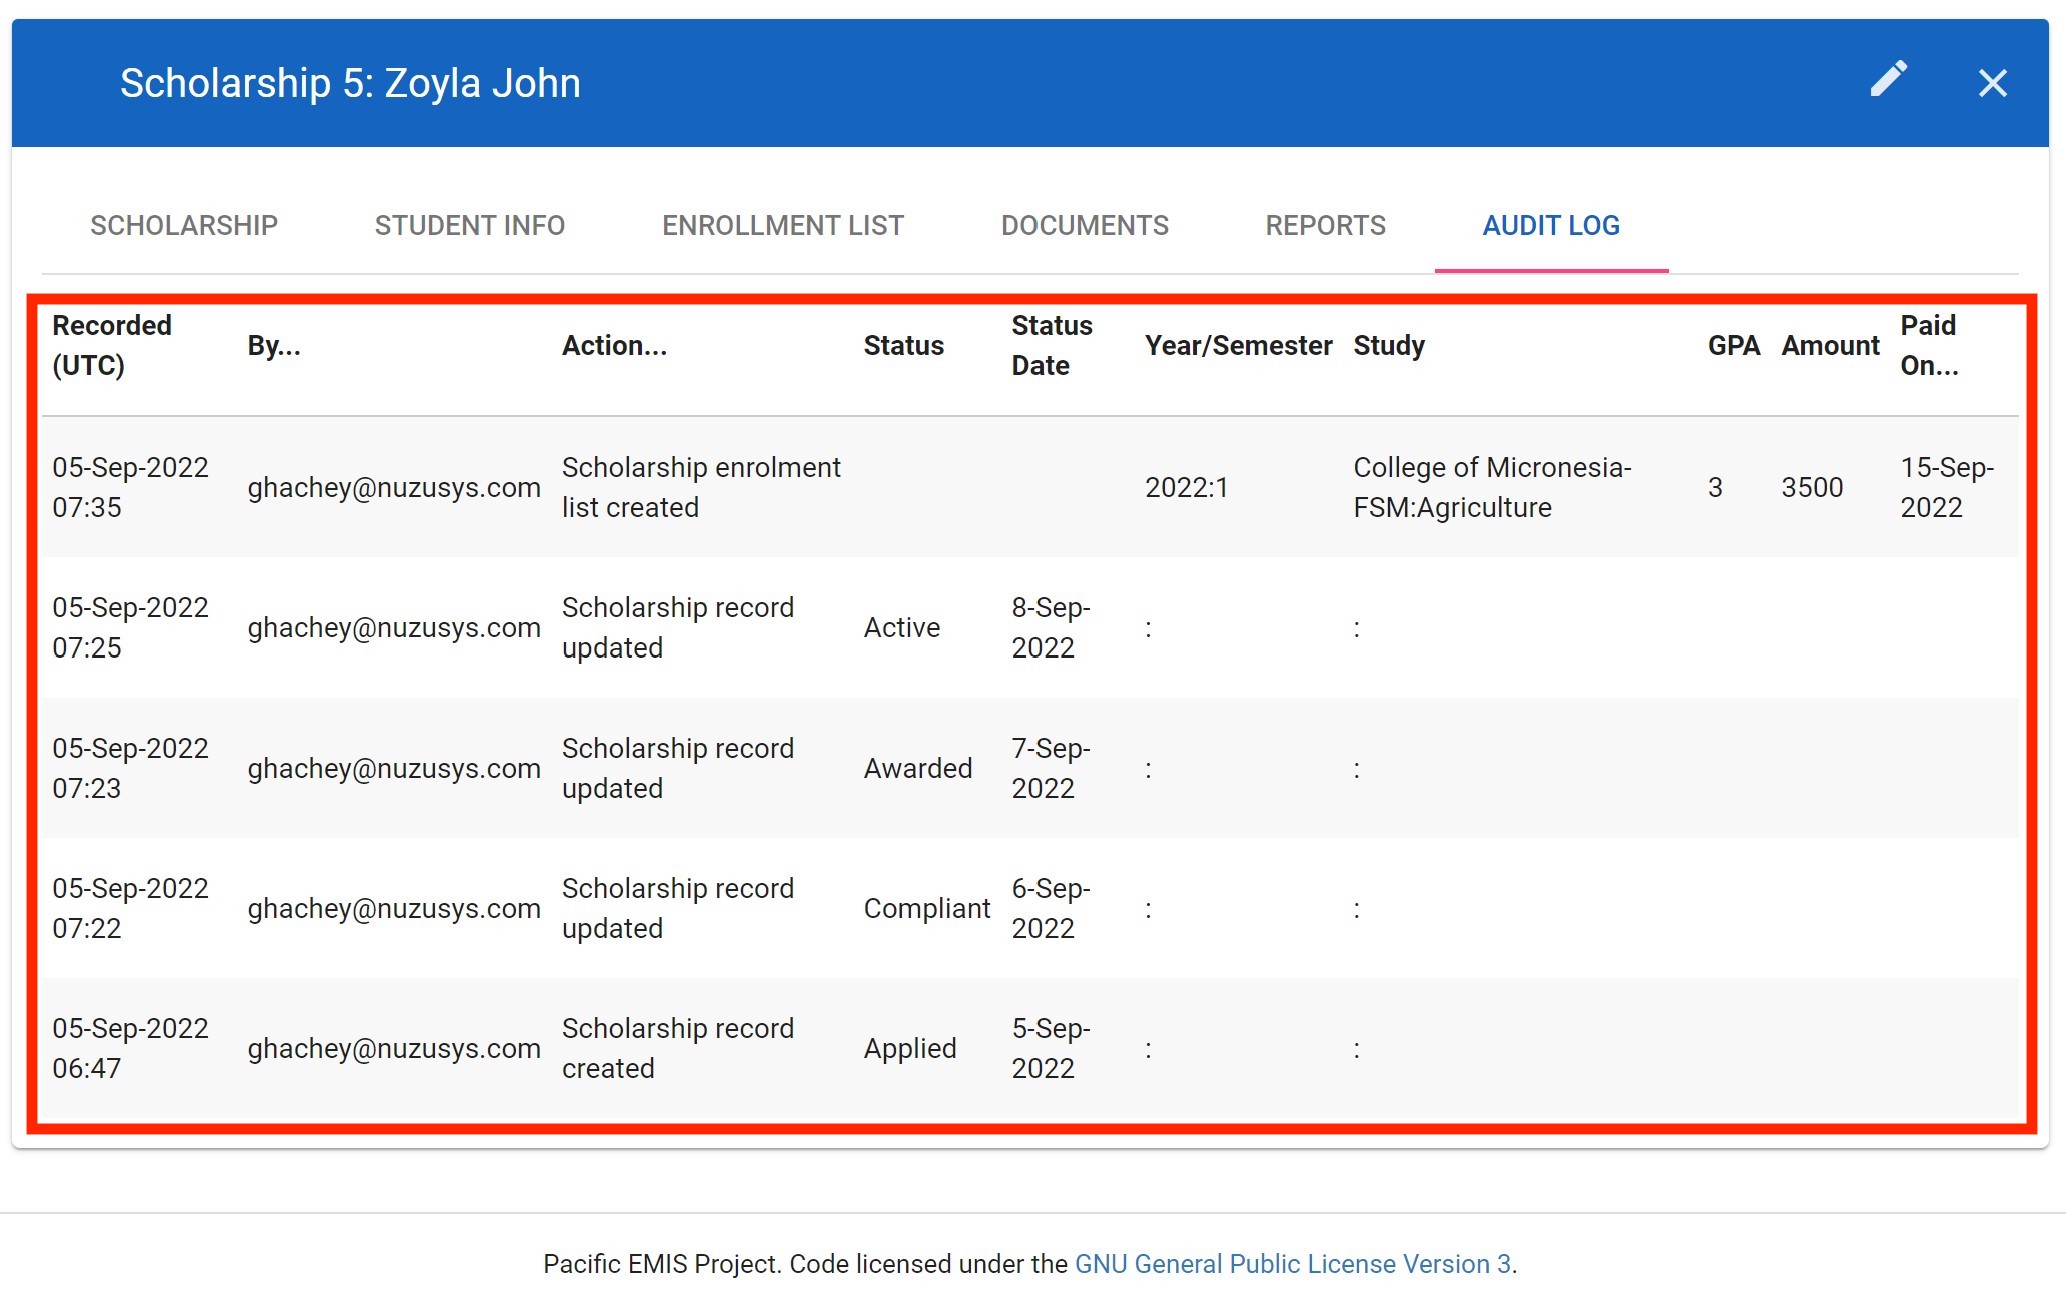
And the nice thing after saving this data entry is that a audit log is created keeping a history of important events (e.g. status change). To see this, click on the Audit tab as shown below and see the very first entry in the audit logs.
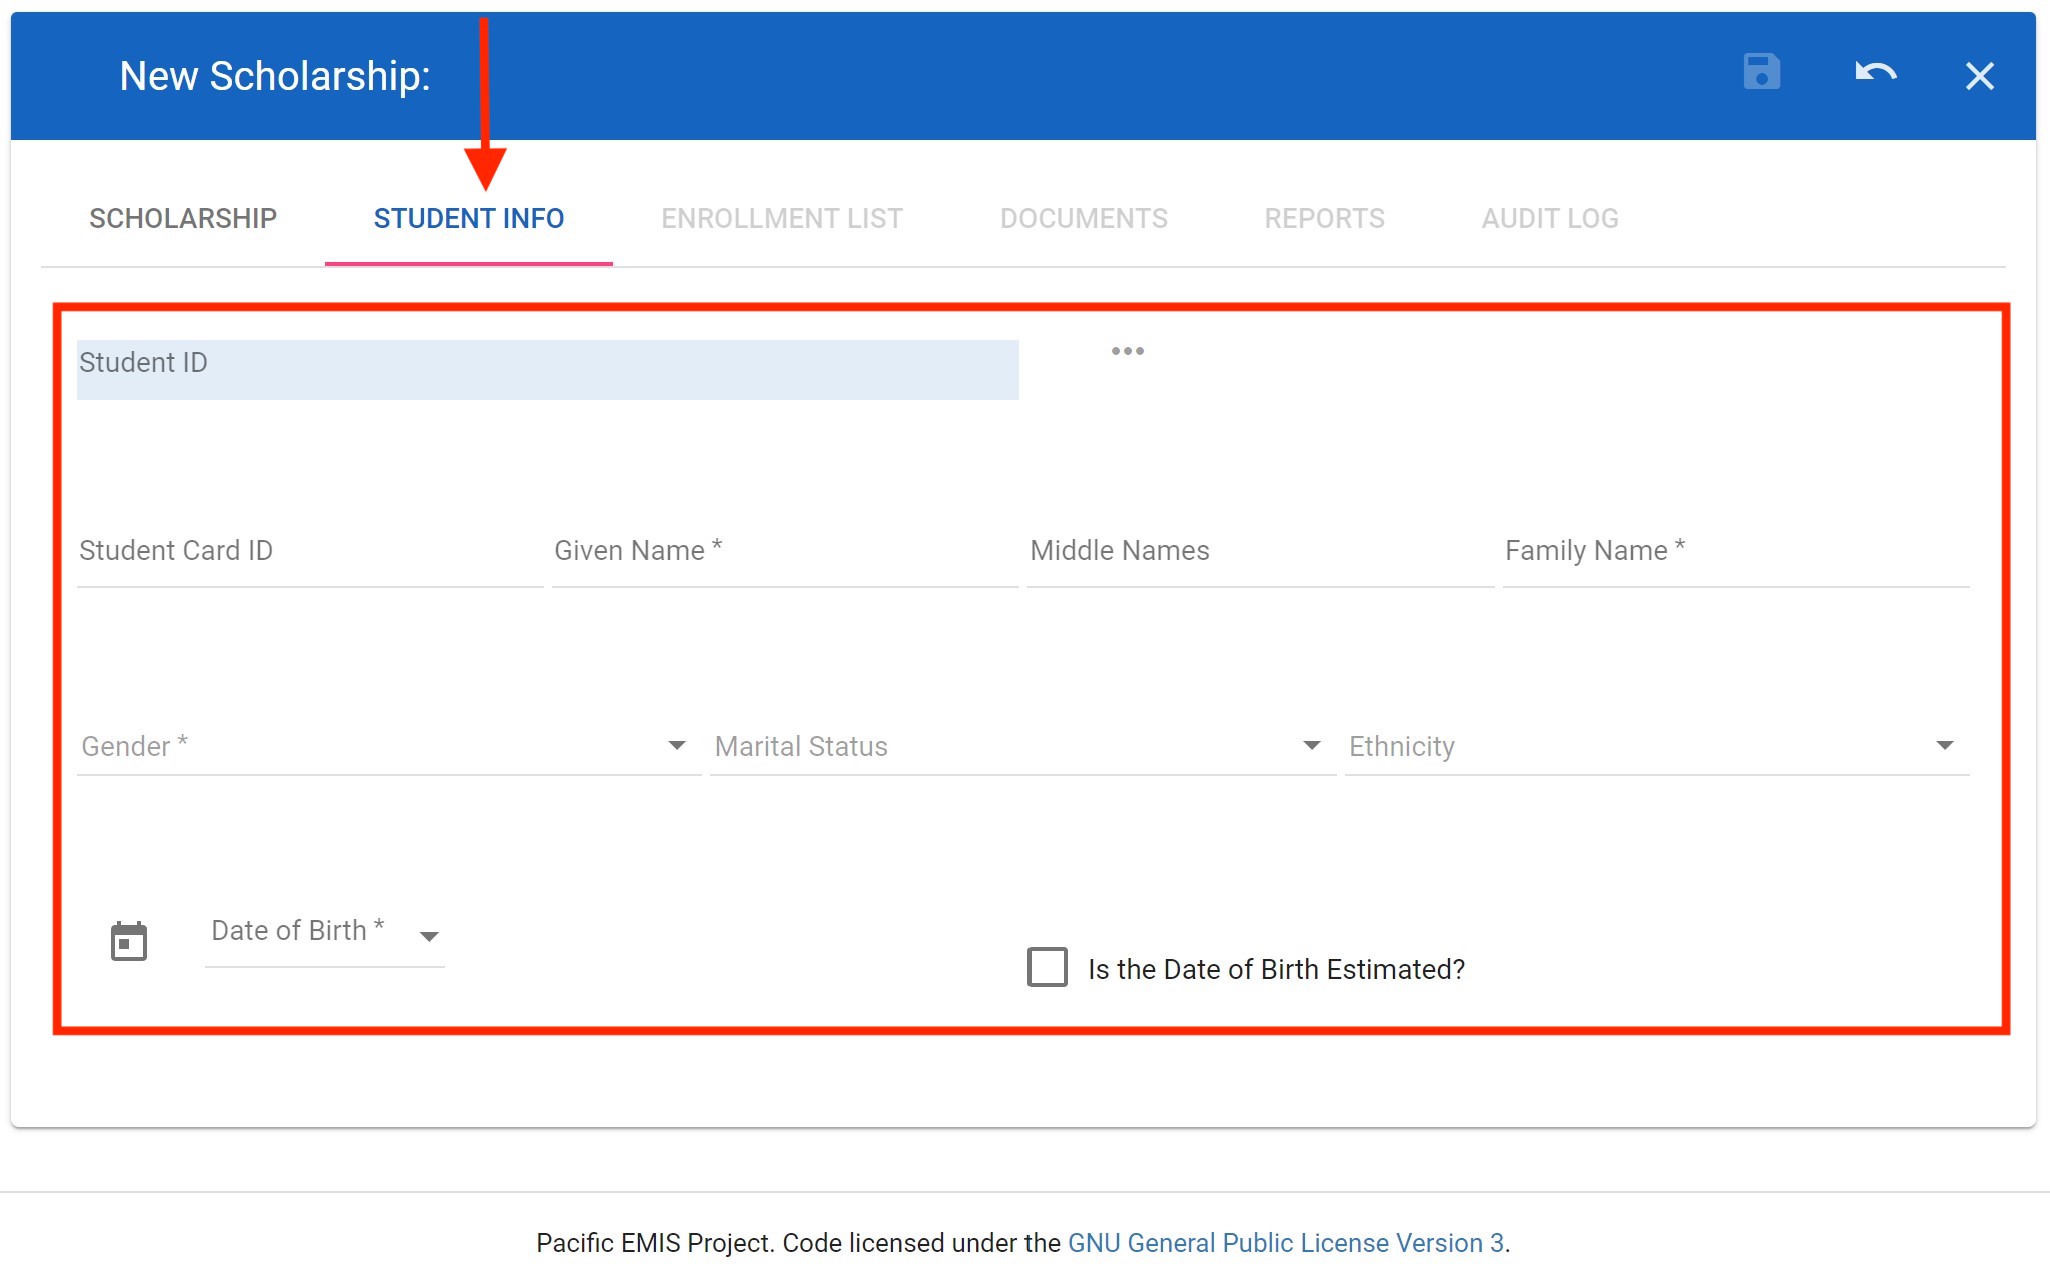
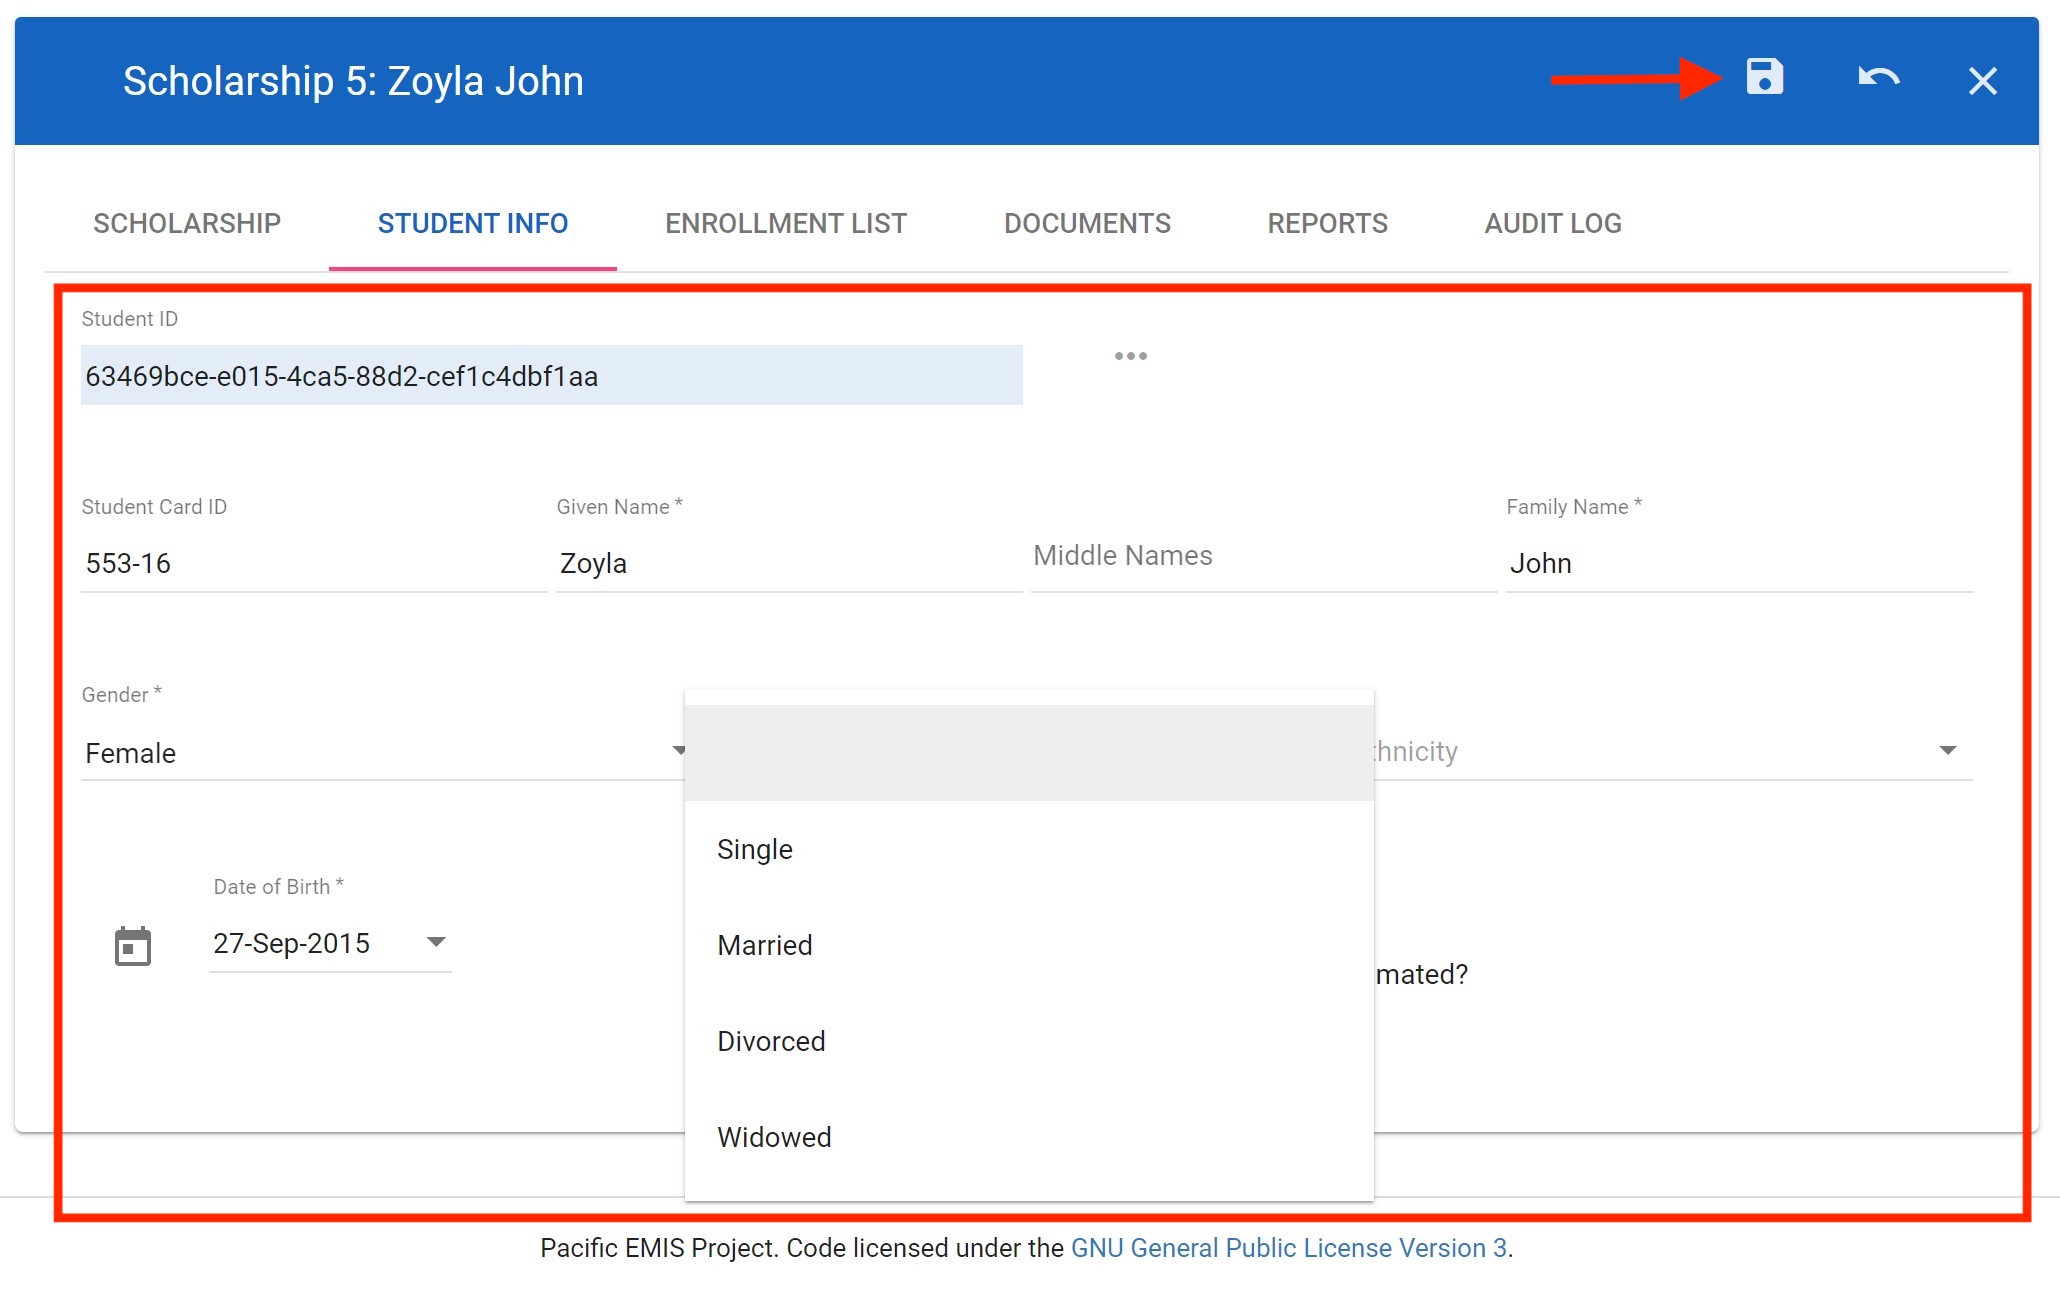
Now let's have a look at the Student Info tab as shown below. A few things to note from the below. You can view the student data, edit the student data (by clicking on the pencil icon) and you can also link to the EMIS student record from the student's school year (potentially accessing more data such as exams performance, GPAs, etc.) by clicking on the horizontal triple dots.
Click on the pencil to edit the student data is likely to be the most common thing you will end up doing. For example, it is possibly missing some data you are interested in such as marital status. Once done editing, you can click on the floppy disk icon as shown below to save your changed.
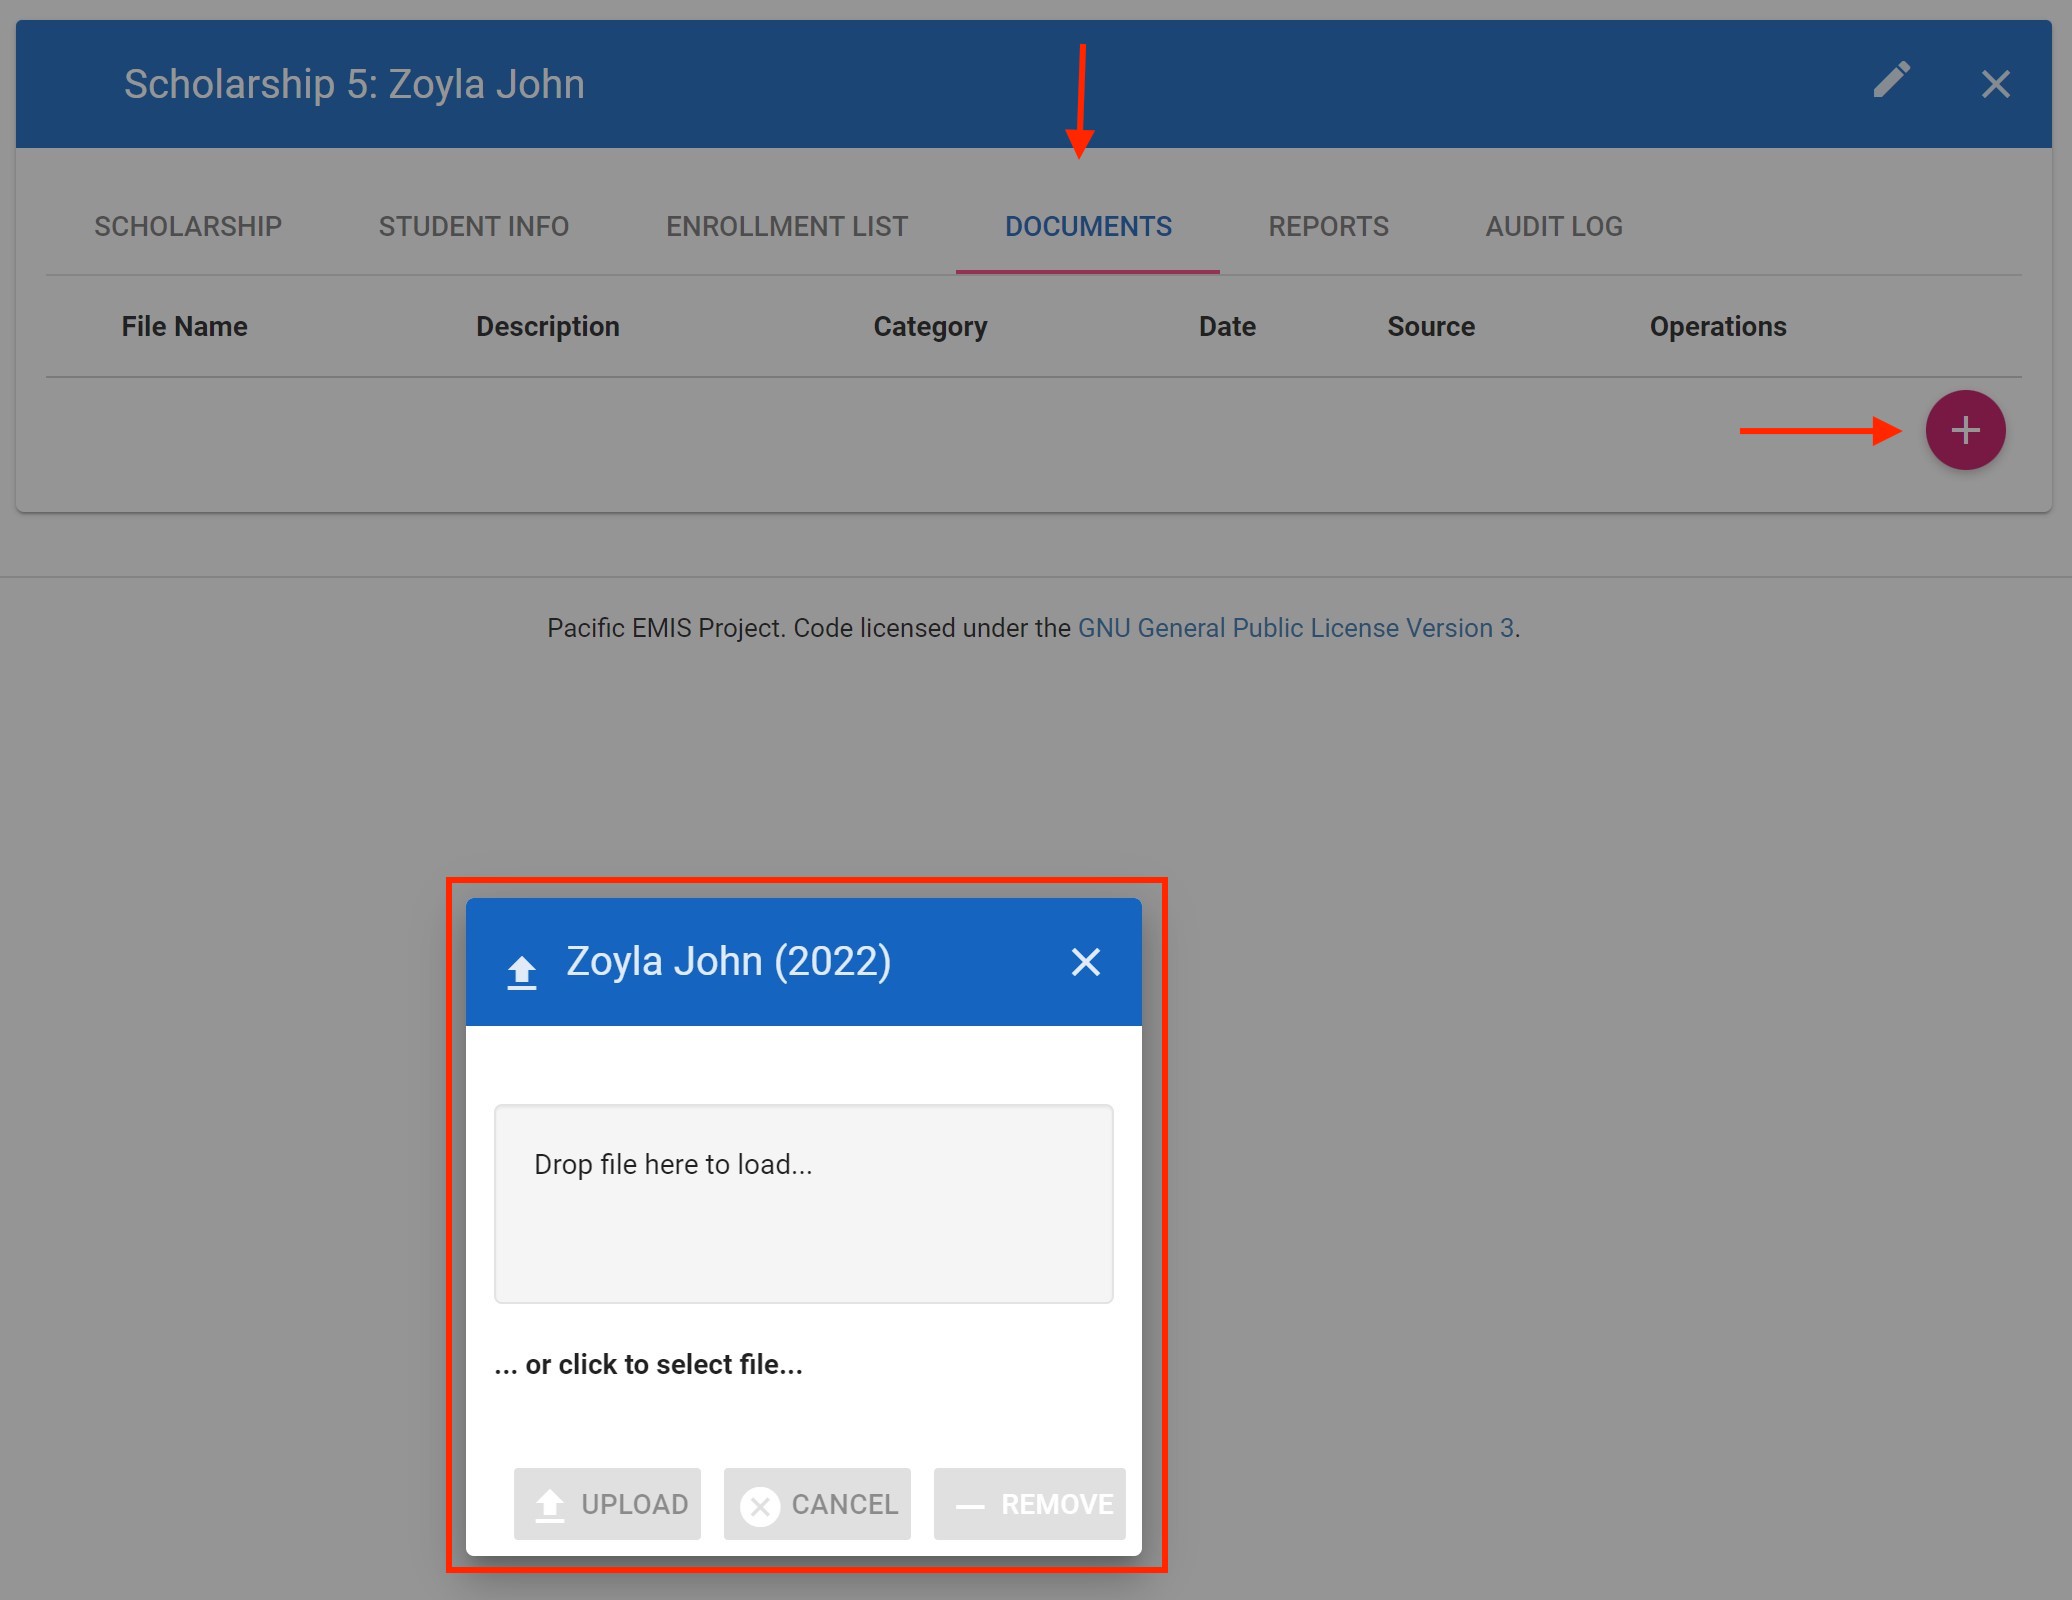
Archiving Evidence Documents
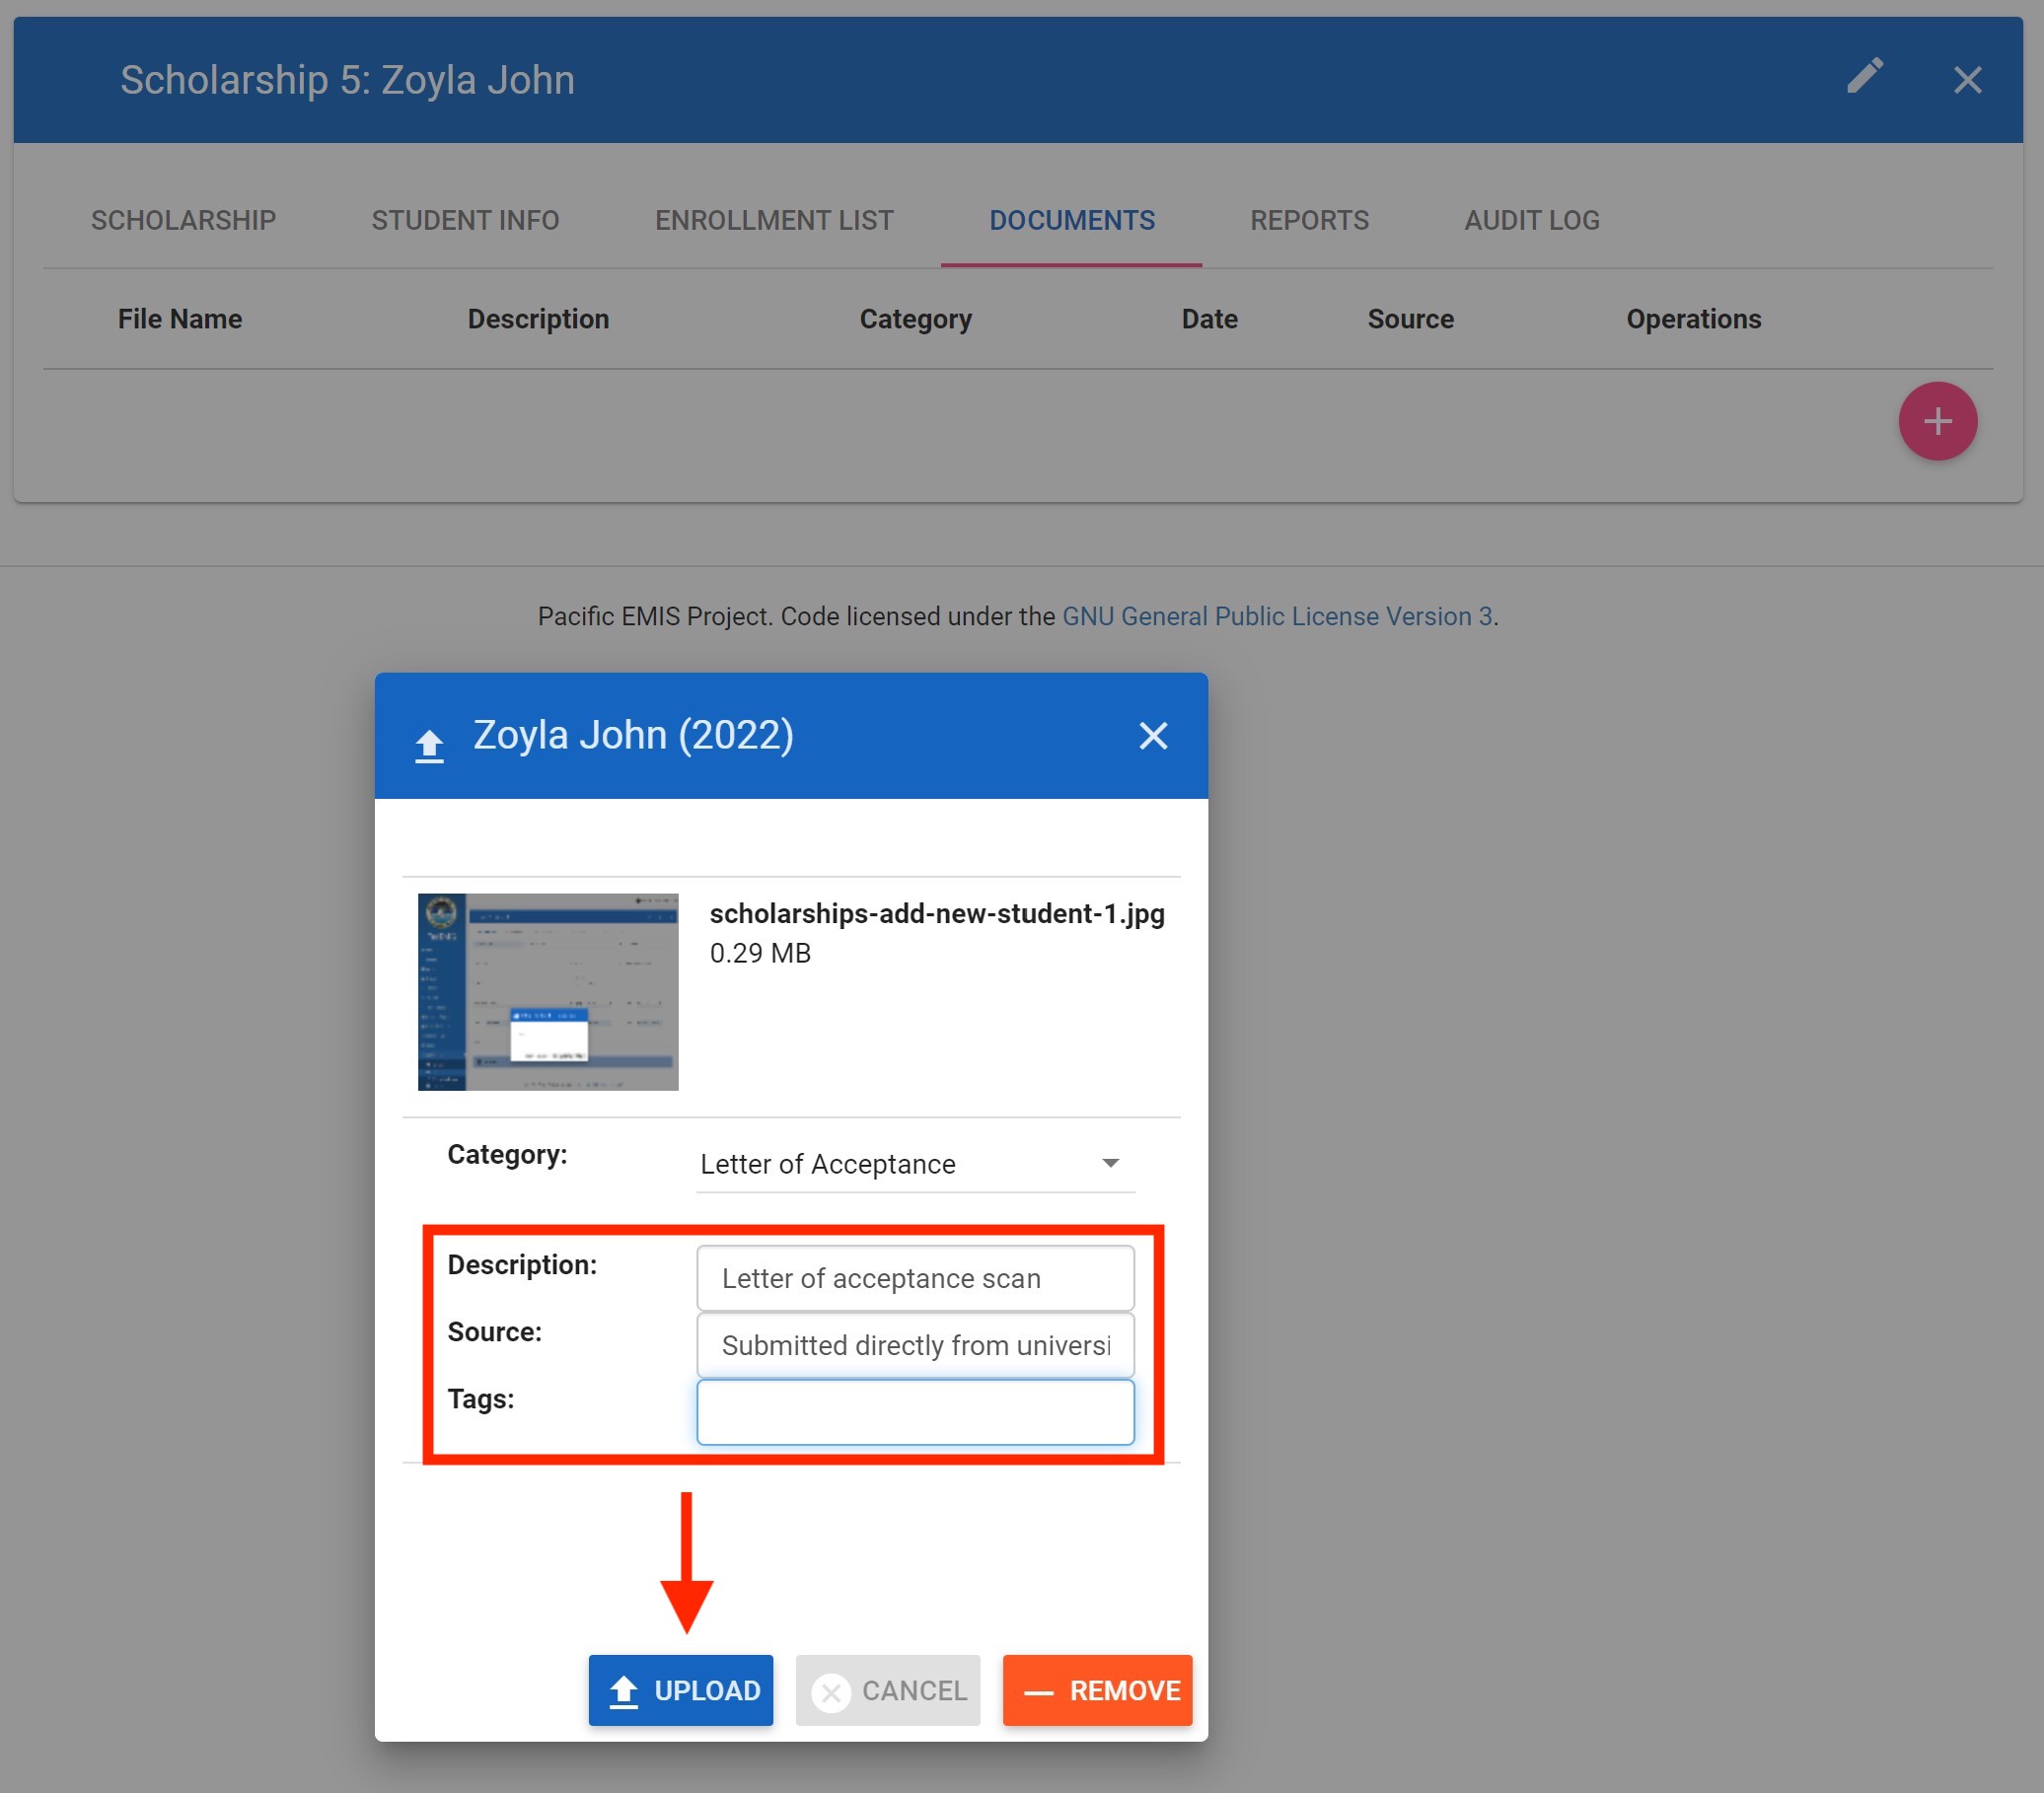
At any time of managing the scholarship data for student you can archive documents in its record. This is useful to include hard copies of submitted forms, letters, official school transcripts, etc. You can do this under the Documents tab. Click on the plus (i.e. +) icon to add a document. Simply drop the document into the box that reads Drop file here to load….
Choose the category of document you are archiving.
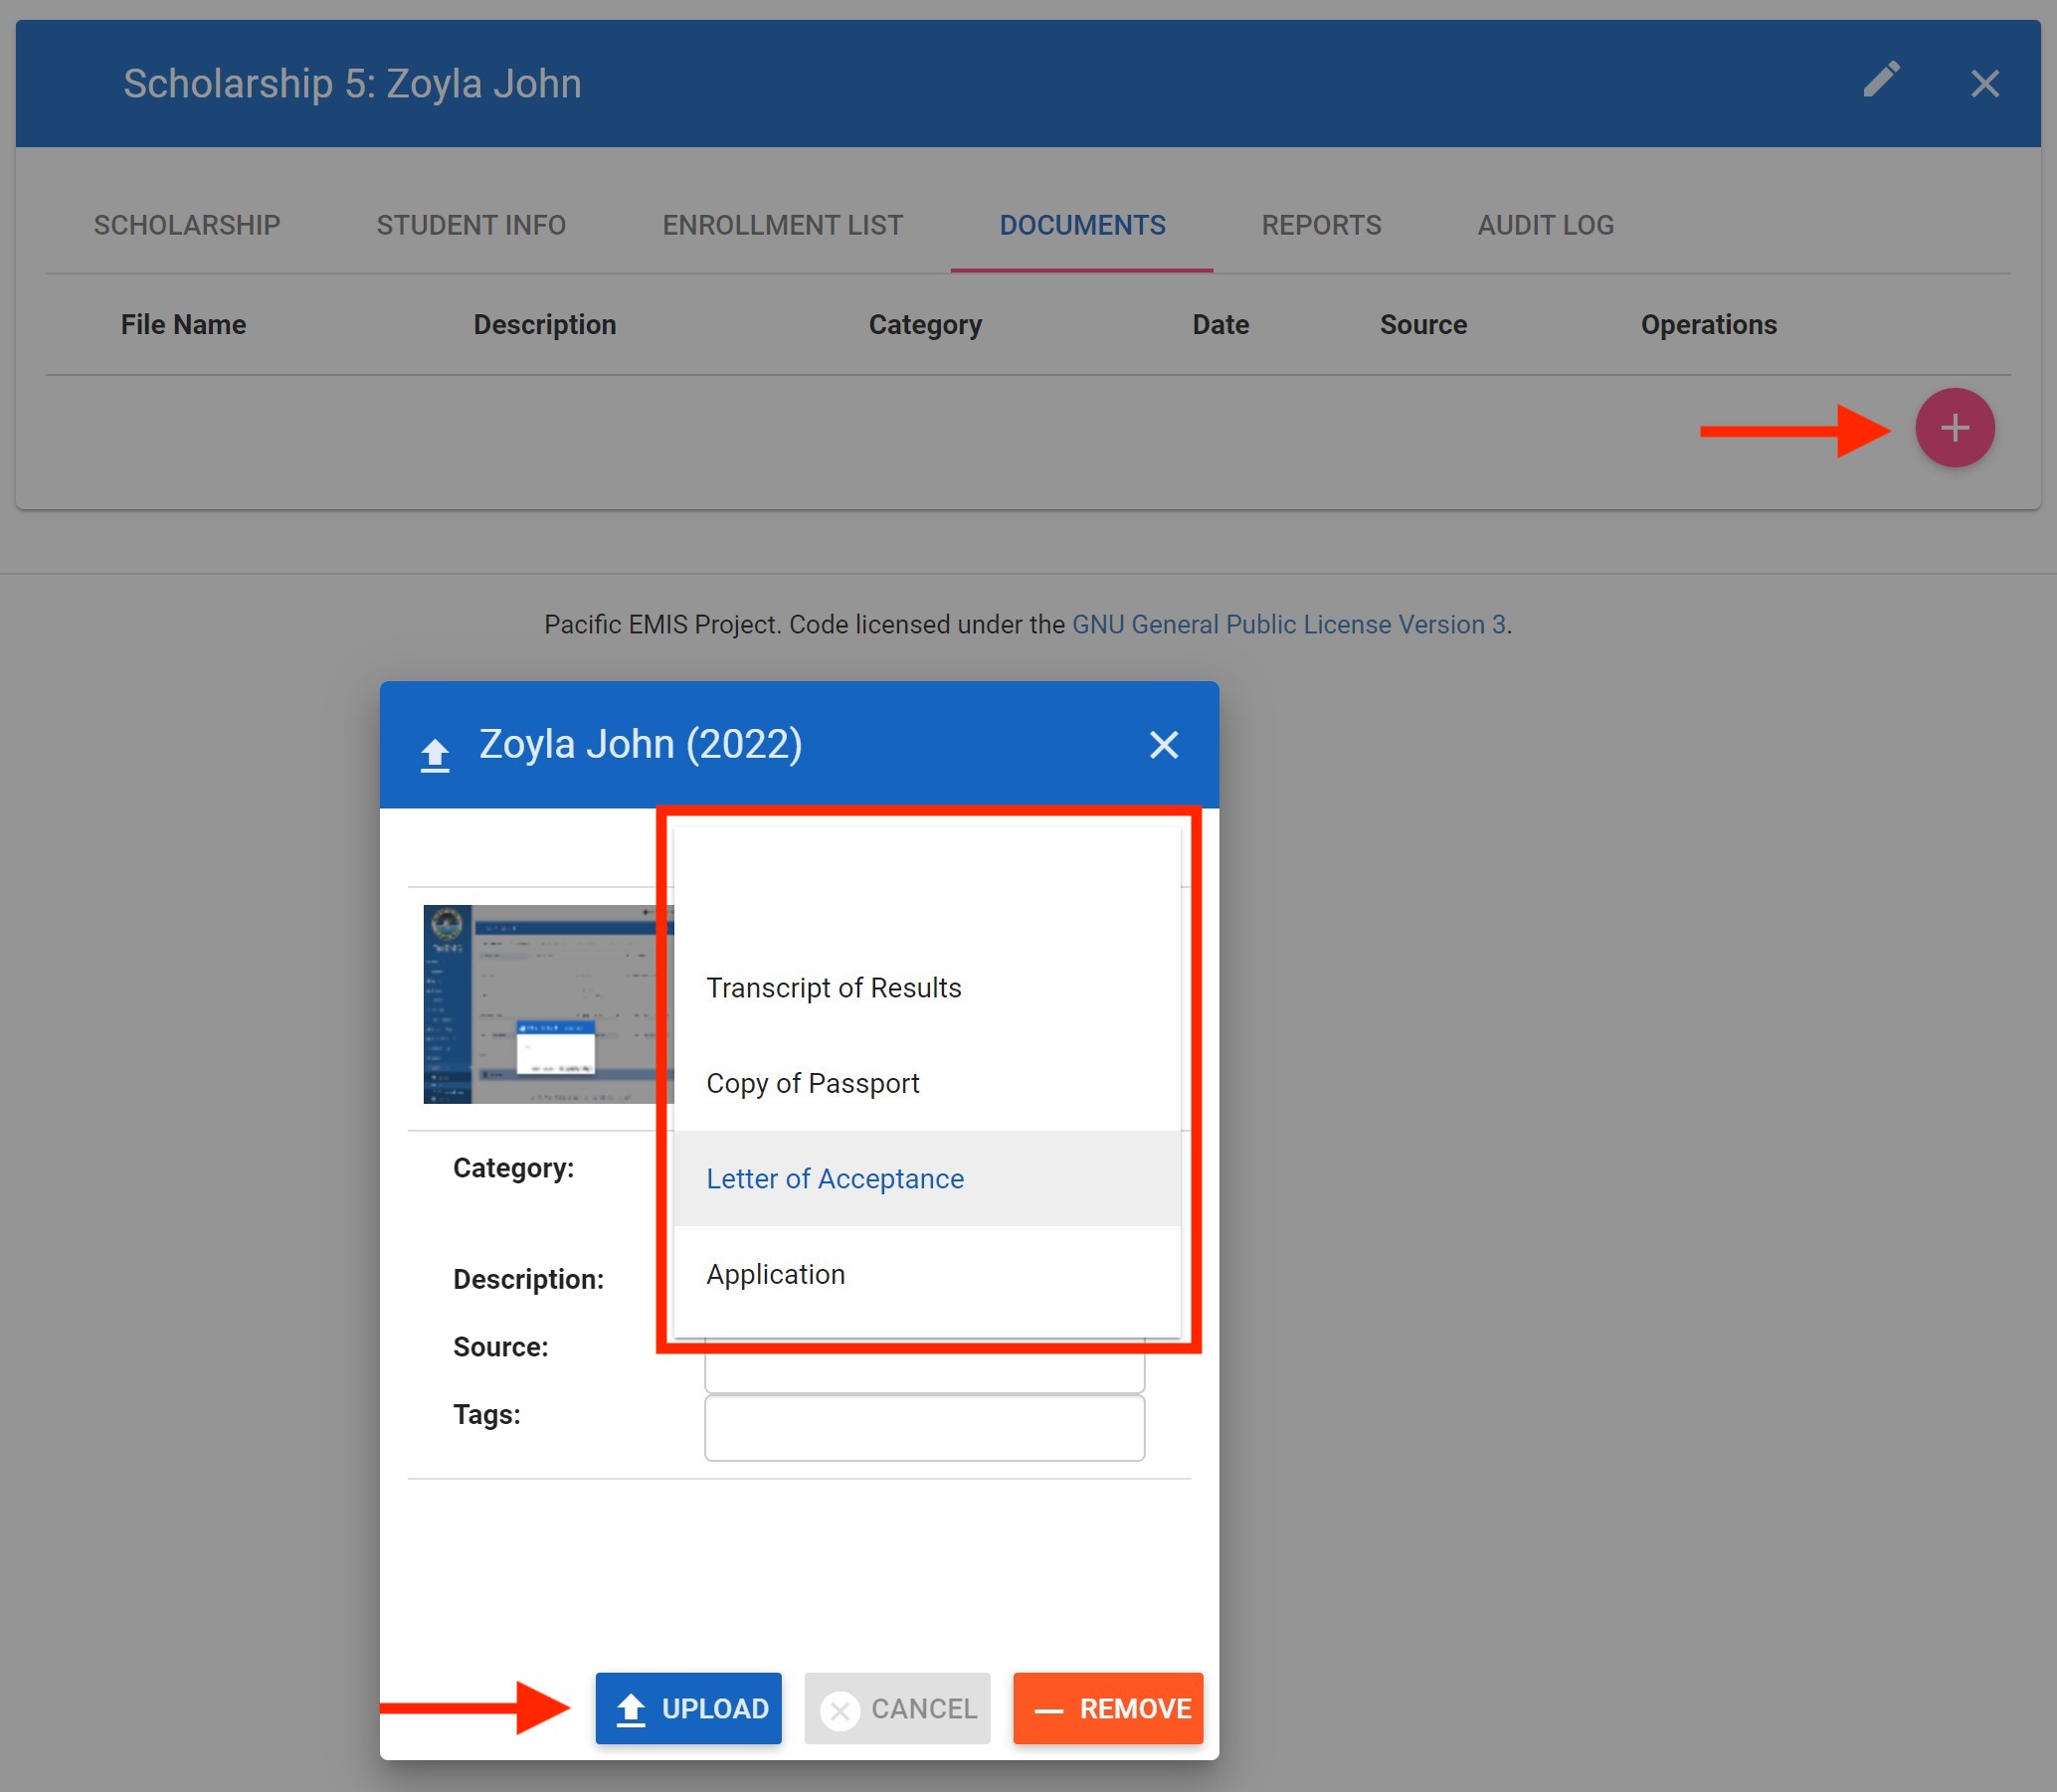
Optionally, put in a:
- Description: short description of summary of your document.
- Source: where you got the document from.
- Tag: any keywords you may want to associate your document with.
And finally, click on Upload. You could of course also Cancel the operation or Remove the document if you want.
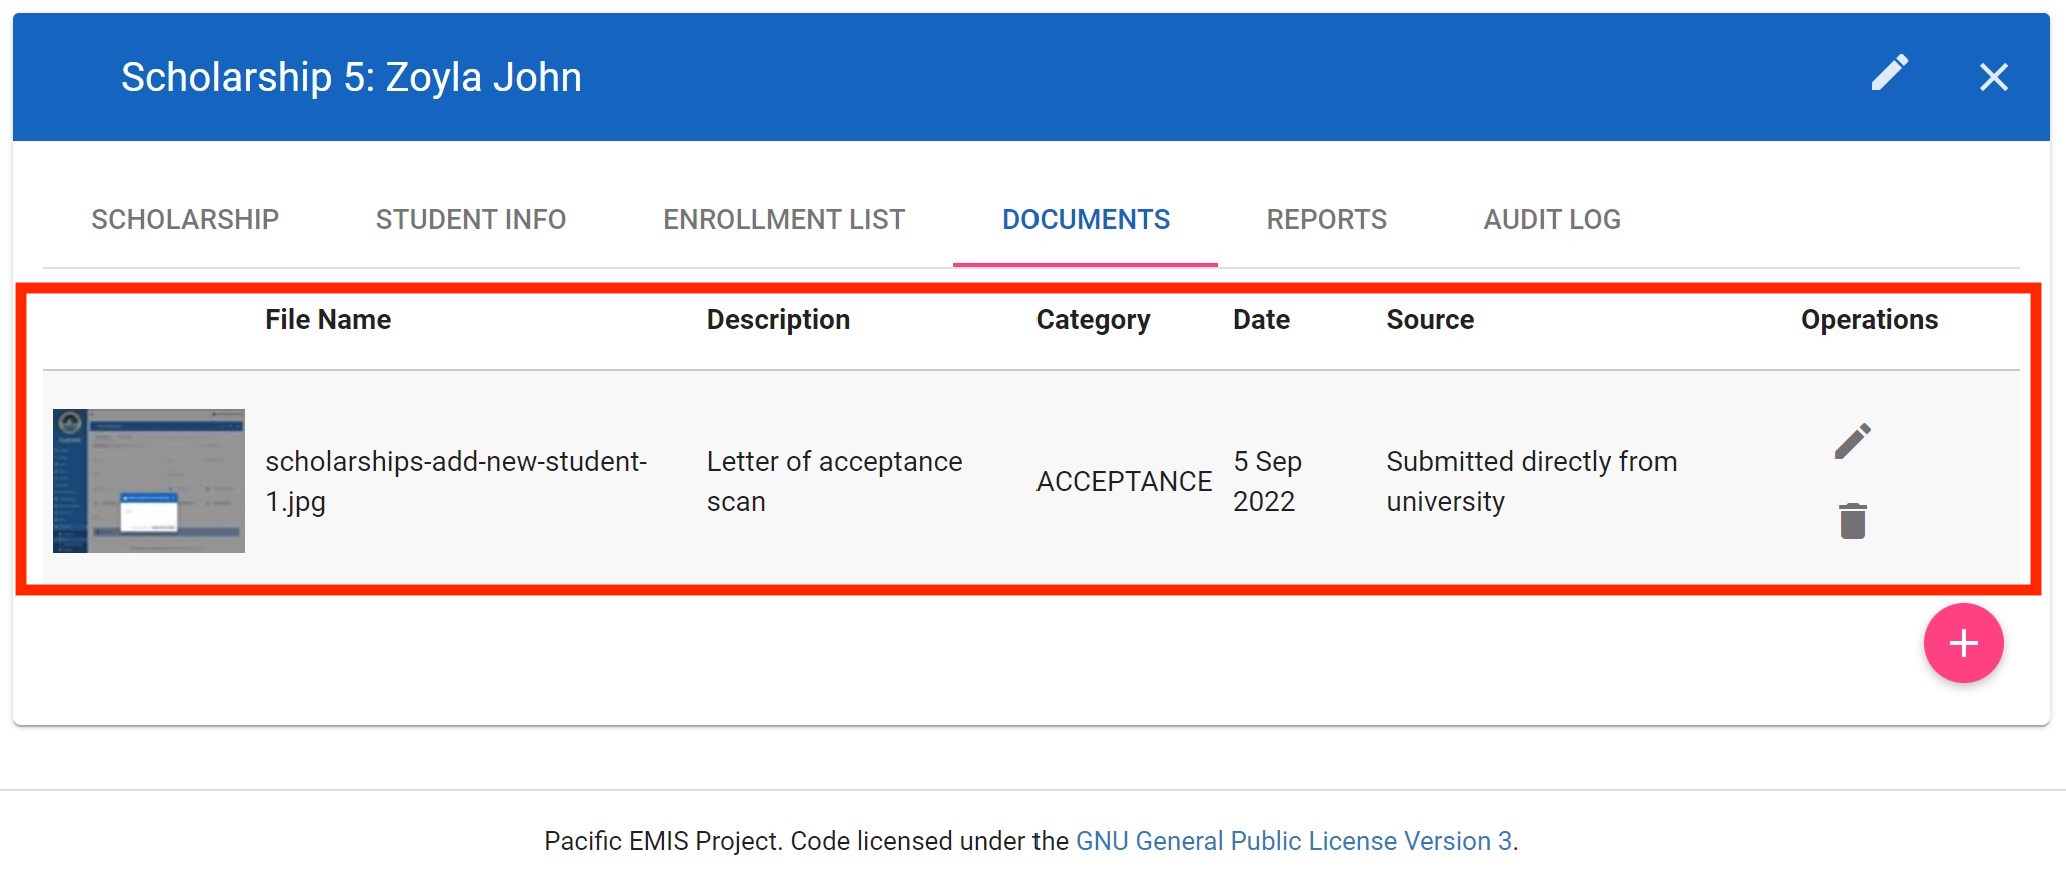
You can add as many archived documents as you like, in fact it is the best way to organize all your records. You will see them listed as shown below.
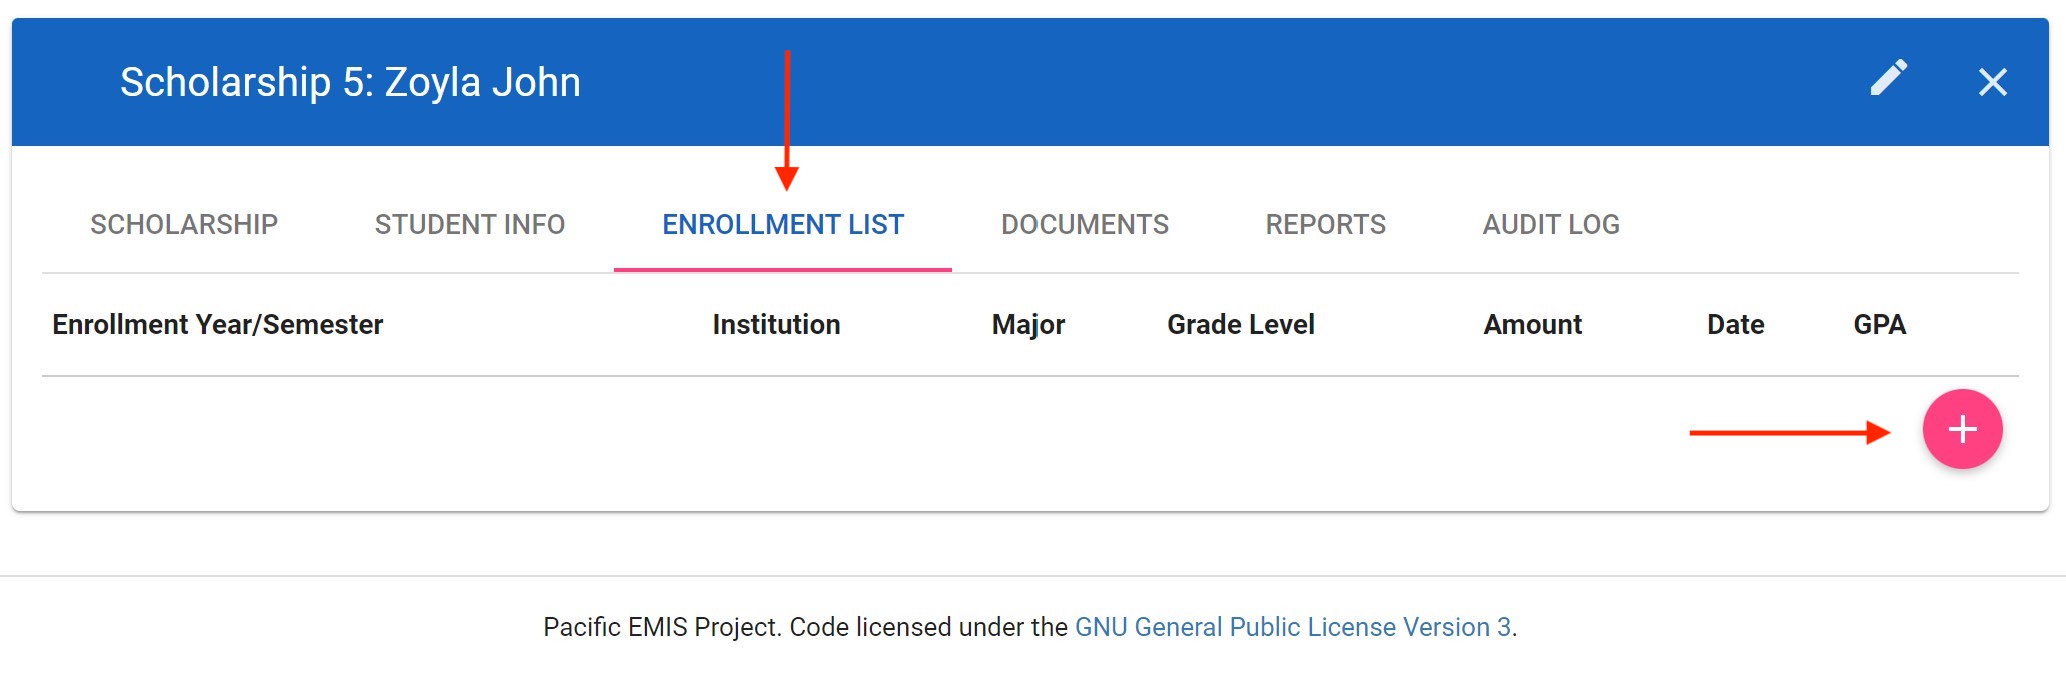
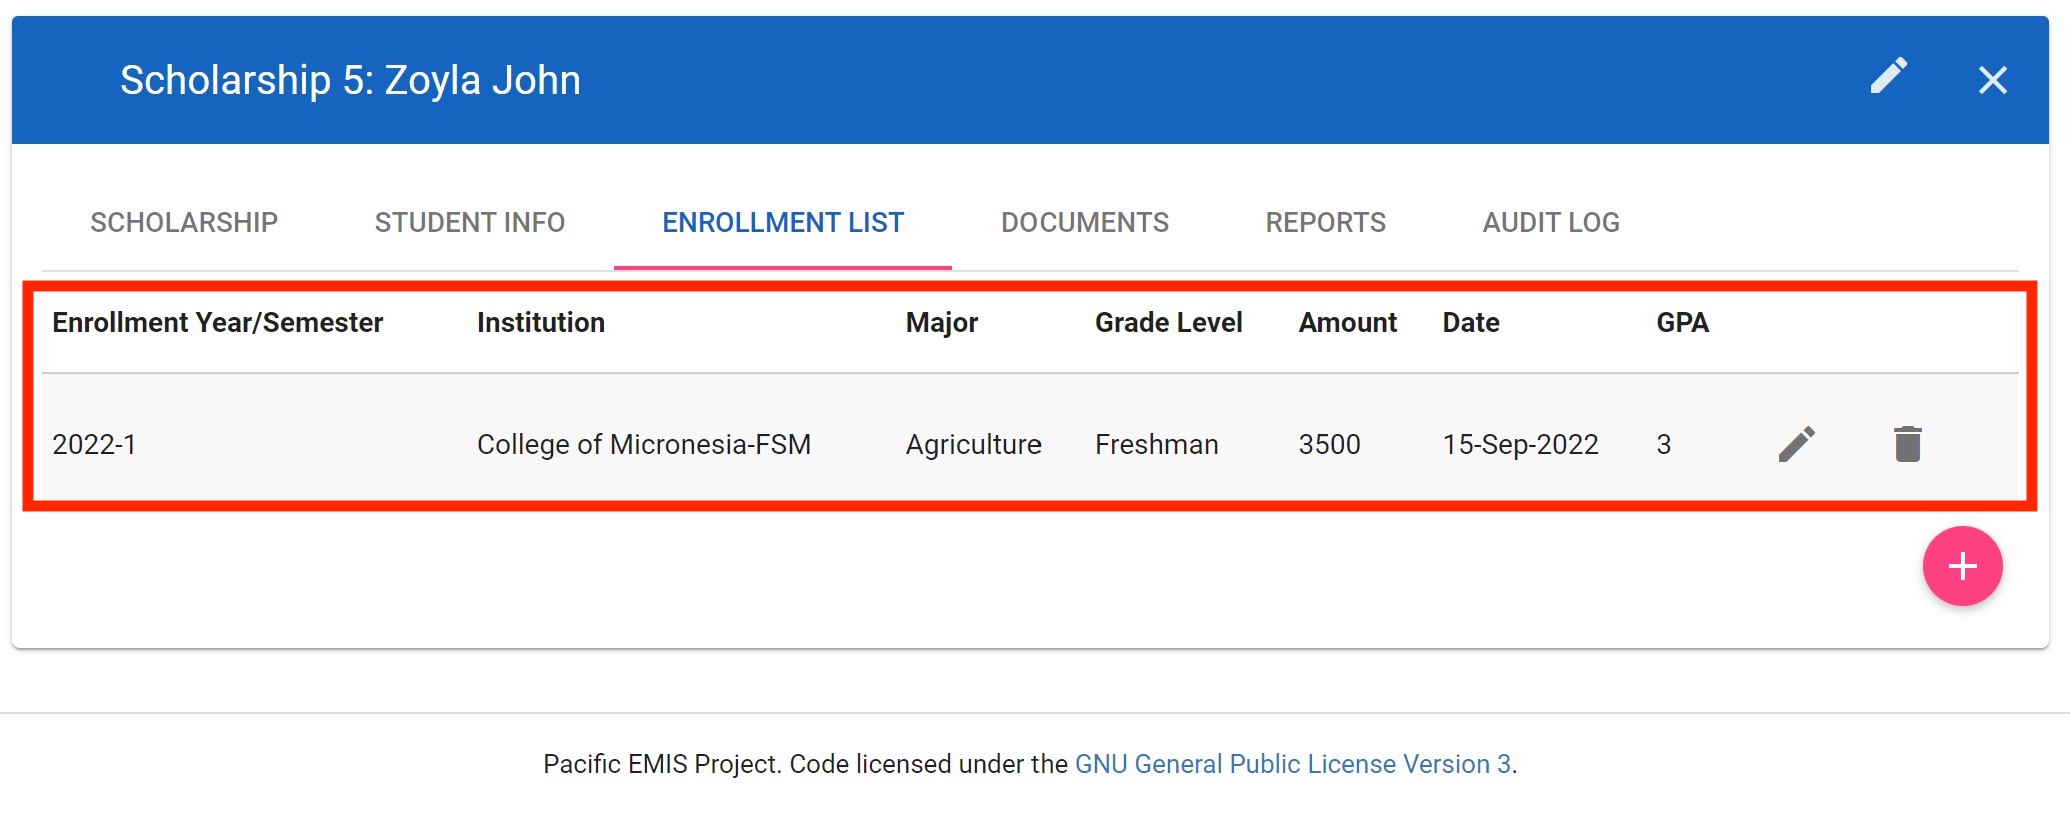
Tracking Enrollment List
You can then track the student's life cycle recording things like the GPA, amount given, etc. You do this under the Enrollment List tab of the student's scholarship record. Click the + icon to add new records.
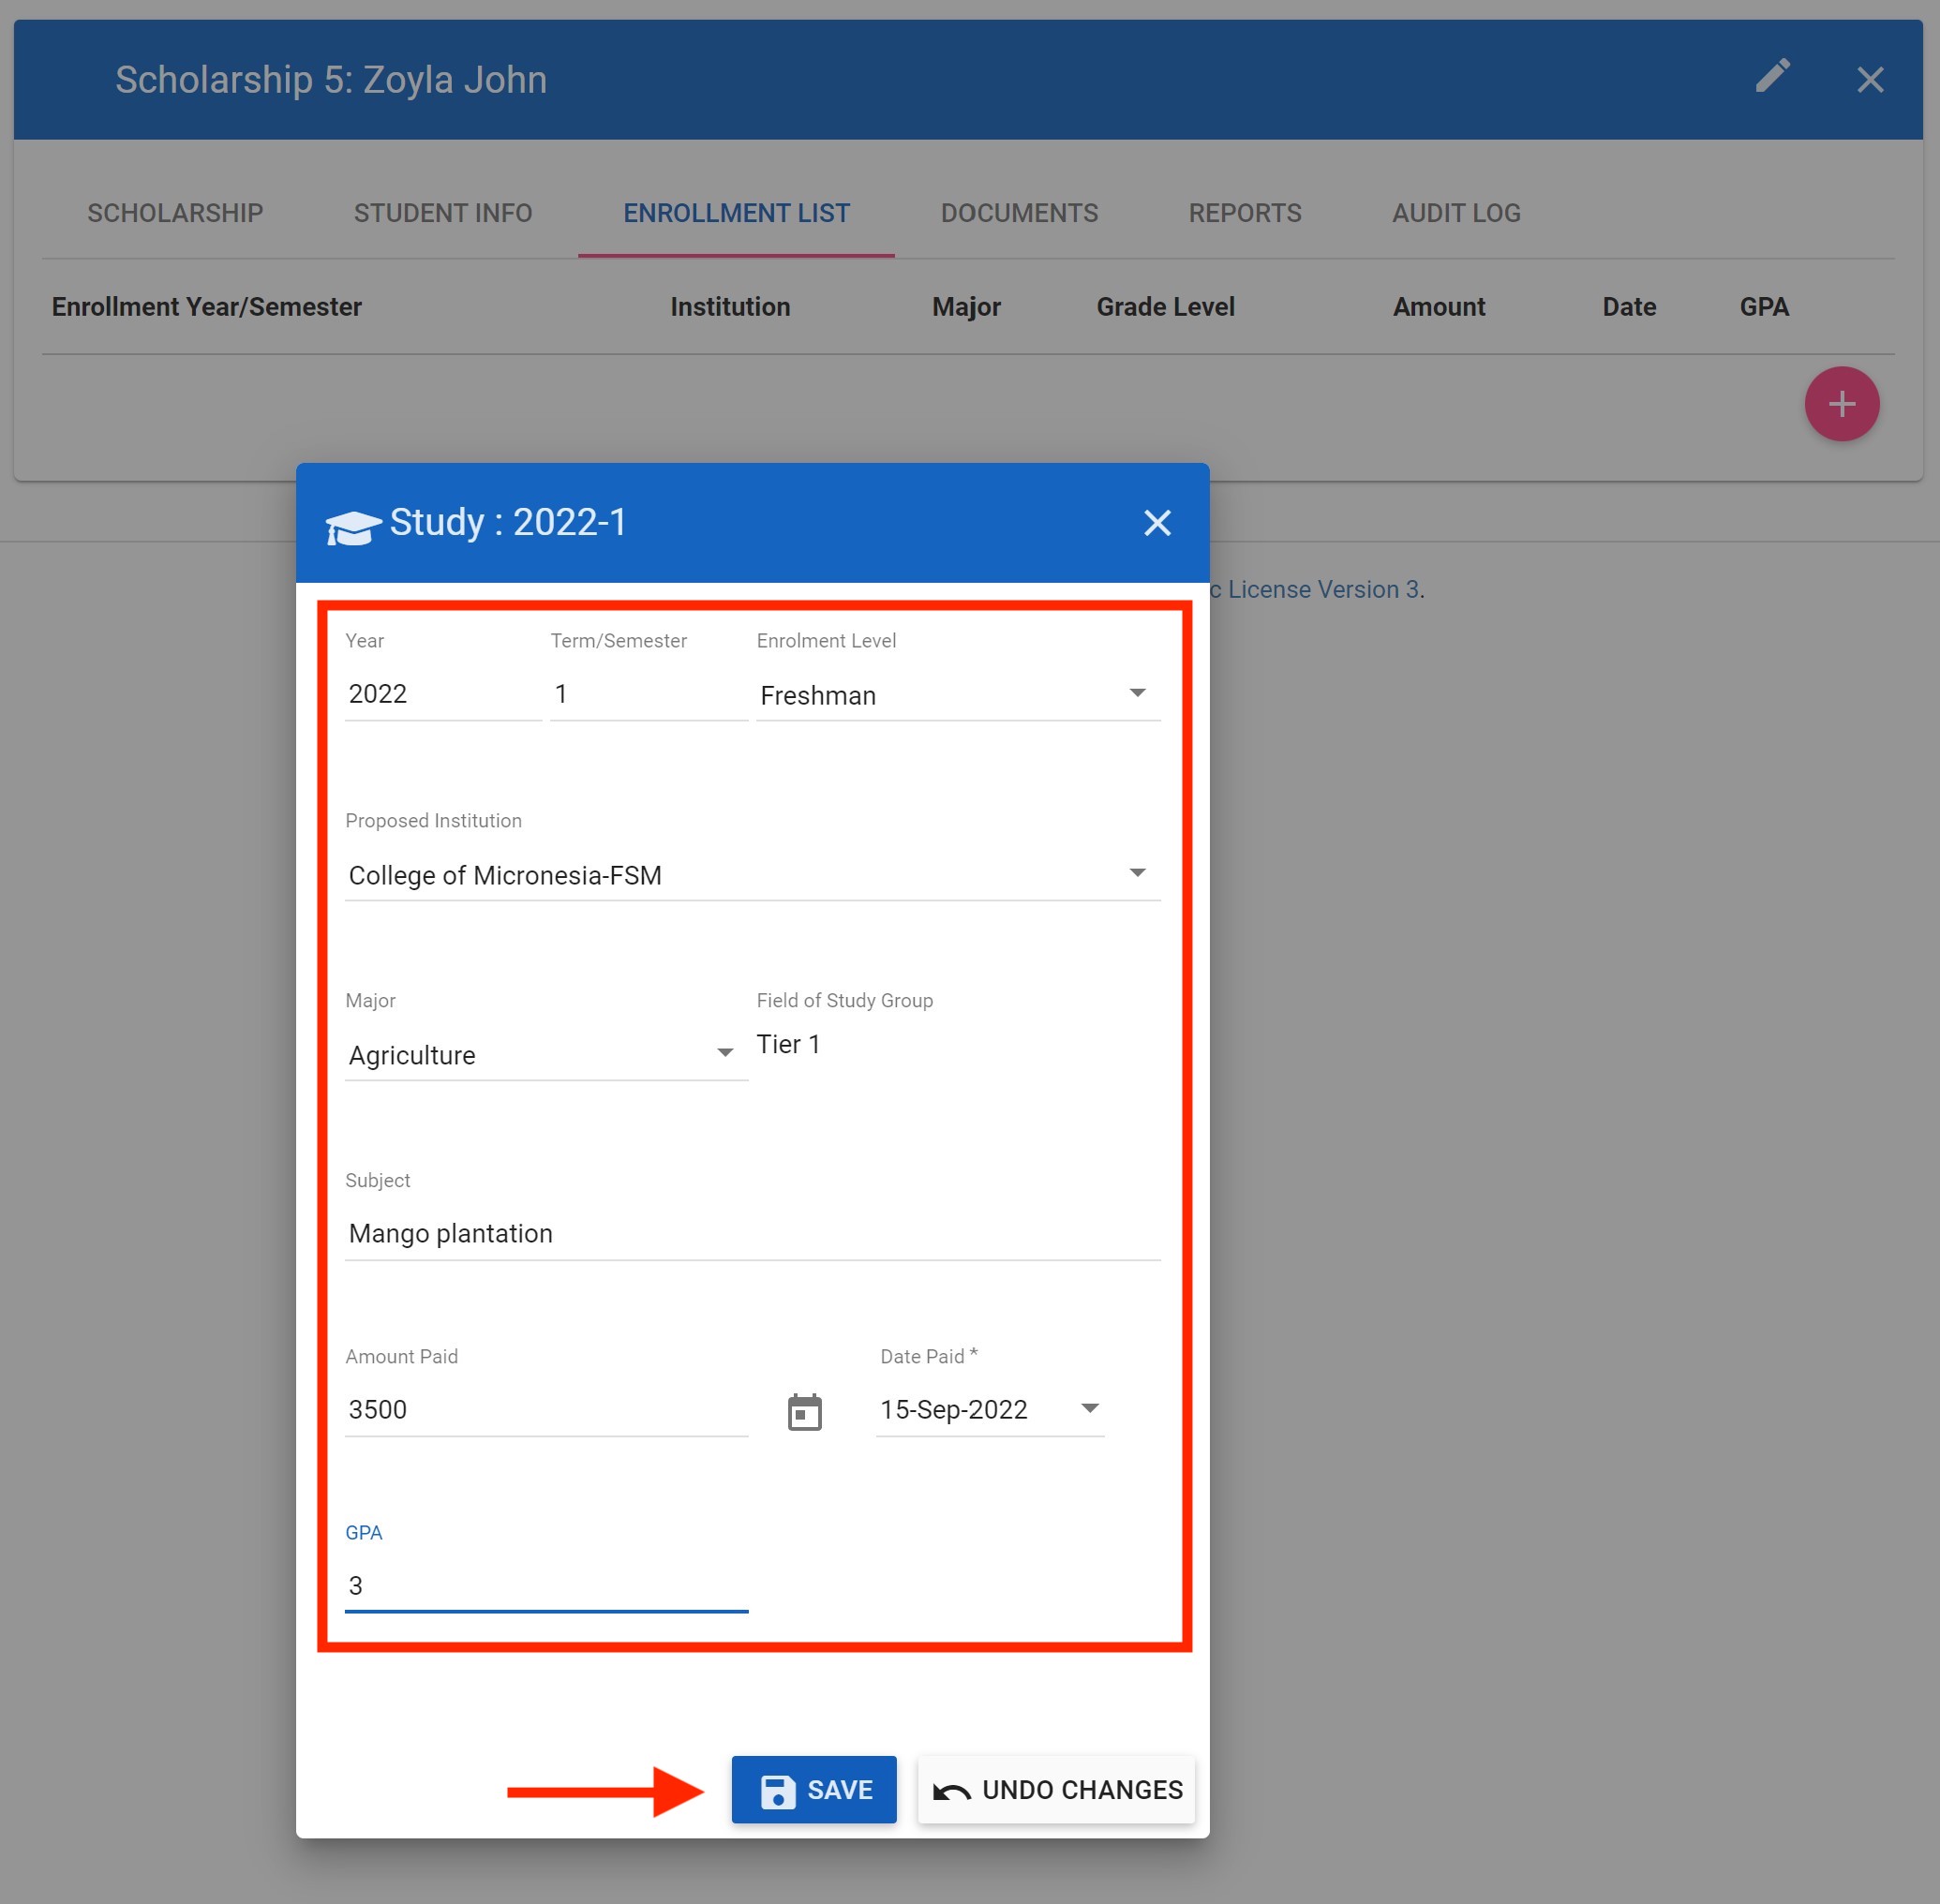
You should see the following where you can put the details including:
- Year: of the student's education
- Term/Semester: of the student's school year
- Enrollment Level: of the student
- Proposed institution: of the student (in case it changes from original one)
- Major: of the student (in case it changes)
- Field of study group: is automatically set with the Major
- Subject: of study of the student (in case it changes)
- Amount Paid: to student if an amount was paid for the term
- Date paid: of amount to student
- GPA: of the student for that term
Then click on Save to record your term data.
You should see a newly added enrollment list record for the student's scholarship record. You can record all the terms and/or semesters of the student in there.
Again, the whole history of important events are recorded in the audit logs. For example, the above added enrollment list is the latest shown record from the top of the list shown below in the Audit Log.
Data Operations
Annual Census Data Transfer
The Pacific EMIS supports a number of ways to transfer data from schools to a centralized database. They have varying degrees of maturity and complexity of user adoption. They are summarized in the below table.
| Method | Description | Maturity | User Adoption Complexity |
|---|---|---|---|
| PDF Survey | A comprehensive survey of data with the majority of it in aggregate format containing enough for the main key performance indicators | Very mature | Easy |
| Excel Workbook | A comprehensive survey of data with support for individual rosters and richer data containing enough for the main key performance indicators and more. Built on widely used spreadsheet (Excel) | Very mature | Moderate |
| Student Information System (SIS) | The highest form of data management within the schools then pushed to the centralized system. An online web-based student information system meant for daily use by schools. | On-going development | Difficult |
Upload PDF Survey
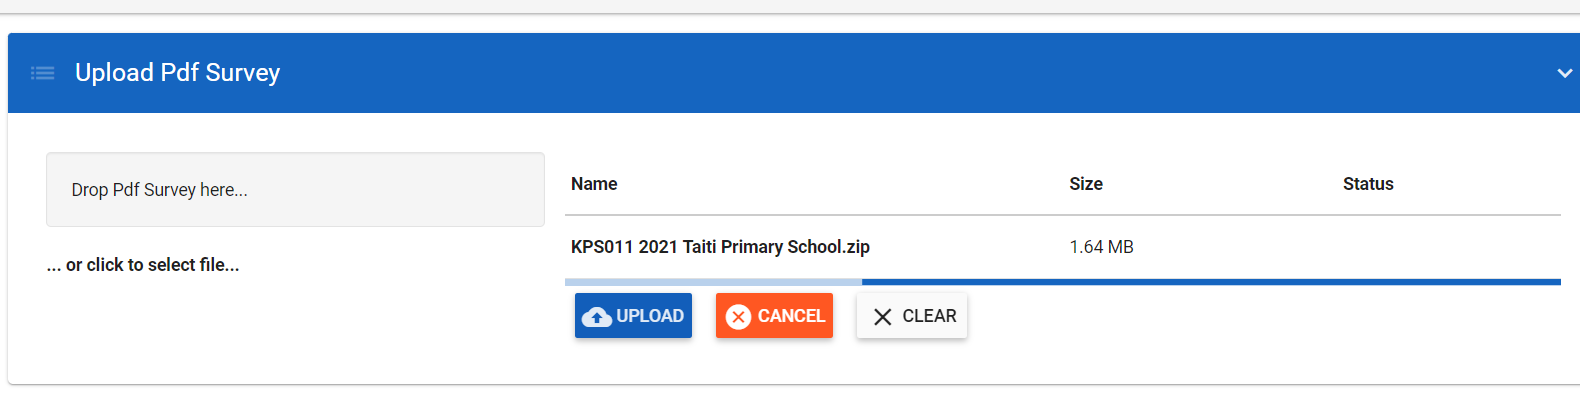
Your Annual School Census PDF Survey must be completed first. Then if you have appropriate permissions you simply go to Data Operation → Upload PDF Survey sub-menu item. Simply drag the PDF Survey as shown below.
Upload Excel Workbook
Your Annual School Census Workbook must be completed first. Then if you have appropriate permissions you simply go to Data Operation → Upload Workbook sub-menu item. Simply drag the workbook as shown below.

You should then see the following where you can proceed to Upload (or Cancel or Clear). Processing will try to upload the workbook data into the EMIS.

If you have issues with your data the system will try to identify them and return some feedback to guide the user in fixing the issues significantly improving quality of submitted data. If you do have issues you will have to Cancel - Discard thus Data.

You will then see the full feedback to guide you to sort out issues in the workbook. For example, below the submitted workbook as the following issues (among others):
- Several unknown school numbers. This means the school name is there but not the school ID.
- Some duplicate records
- Incomplete name
- Missing gender
- etc.
For most of the errors the system tells you how many times it detected the error under Occurs, the first row it see the error under First Row and the last row it saw the error under Last Row.

After fixing all the errors and trying to re-upload you should eventually have a clean file and see something like the following. When clean you can click on Process this files.

You will then see it loading. Be patient as it could take some time as there could be a lot of data to process.

When complete you should see something like shown below. There are multiple data grids which you can have a good look at to verify all numbers one last time by comparing with the numbers in pivot tables in the workbook.

Rollover Workbook
EXEC pSurveyWriteX.CreateSurveyYear 2023, '2022-12-31','2022-11-30',6, 'your-user@email.com'
The workbook census rollover can work for all schools at the national level, at the district (e.g state, province, etc.) level or individual schools. It is the recommended way to get started on a new school year data as it contains cleaned up data and reduces chances of introducing duplicates or other messy data.
Enter the year from which the rollover should be computed. For example, entering the year 2021 will get the data from SY2020-21 process all students and teachers based on their end of year outcome data. For example, students with outcome completed will be promoted to the next grade, dropped out will be removed, repeating will remain in same grade. It also handles transfers to other schools and more. It will then prepare a SY2021-22 workbook with all the data ready and the workbook only needs to be filled with new data. In general, this means:
- new students arriving (most often into ECE or grade 1).
- Any news students starting in later grades.
- Any new staff
- Final verification that all the teacher/students for each schools are all as expected
- Final verification of School and WASH data
Upload Exams
The screenshot where exam data can be uploaded looks like below. Some data was already loaded so you can get a preview of reports coming to the EMIS in the “reports” sub-menu item.

Deduplicate Teacher
Inevitably duplicate teacher records find their way into the EMIS. This can happen if the teacher was added manually and then added through the School Annual Census Workbook. Or even if the teacher was only added through the School Annual Census Workbook but with a slightly different name spelling or date of birth. There is no way for the system to know that this was suppose to be the same teacher. This has repercussion in the reporting of data has some of the figures such as total teacher qualified or teacher pupil ratios can be bubbled up.
It is a very good idea to constantly clean the teacher duplicates. The first time this is done there might be many. However, once cleaned up de-duplication can be done yearly after the workbook is loaded and there should be much less to clean up.
The feature can be found under Data Operation menu item as shown below.

Here you see a standard list screen, with access to a filter box. The filter lets you decide which fields in the teacher record to match on. You click on the button to cycle between the following:
- Matching ( = )
- Different ( <> )
- Ignore
For example to find all pairs of records that match on given name and family name, see the following. After clicking on Filter it will pull a list of all teacher duplicates with same given and family name in the system.

Of course you could search for duplicated in a number of creative ways, for example:
- Matching given name, family but different gender
- Matching family name and date of birth but ignoring given name (in case some duplicates in there have a mispelling in the first names)
A good start is to match all given and family name and sort out all the duplicates first then try others searches. Once you have a list of duplicates you can optionally check the associated records as shown in the following figures. Click on the “compare surveys” as shown below.

You will see something like the following though you may also see data showing on both side (both duplicate records found).

This merely shows you the two records. Something you might notice what went wrong sometimes not. In either case, you need to merge both as shown below by clicking “Merge these two records”.

You will see the two duplicate teacher records side by side. The one on the left will be to delete and the one on the right to be kept. Notice in the following example how the one on the left contains a couple of dates there are noton the right. You can click on Edit button as shown in top right of following illustration when ready to edit (merging date is considered editing).

You may click on the switches to pull information from the left into the record that will be kept as shown below. When you feel the record on the right as all the information as you want it you can click on Save as shown below in the top right.

The system will show you it is about to merge and ask you to proceed.

It will then shown you it was complete and ask if you would like to see the merged teacher record.

If you say ok to previous step, you will see the newly merged Teacher with all the data from the deleted record. Notice below how the dates are not there also.

The remaining of the record now also contains a cleaner more complete history of surveys and appointments.

And if qualifications where managed in a separate record they should all end up under the new single teacher profile.

You now have slightly cleaner data. Do this for all teachers and y our data will become of very high quality.
System Admin
A section for systems administrators of the EMIS. Here the sysadmins can define system wide lookups, management users, groups and permissions and more.
Lookups
Lookups are essentially the configuration of your system. They may or may not all be required. Most are straight forward list of dropdown values seen elsewhere in the system. Others are a little specialized and require a bit more details. You can access the lookups typically from the menu under System Admin → Lookups.
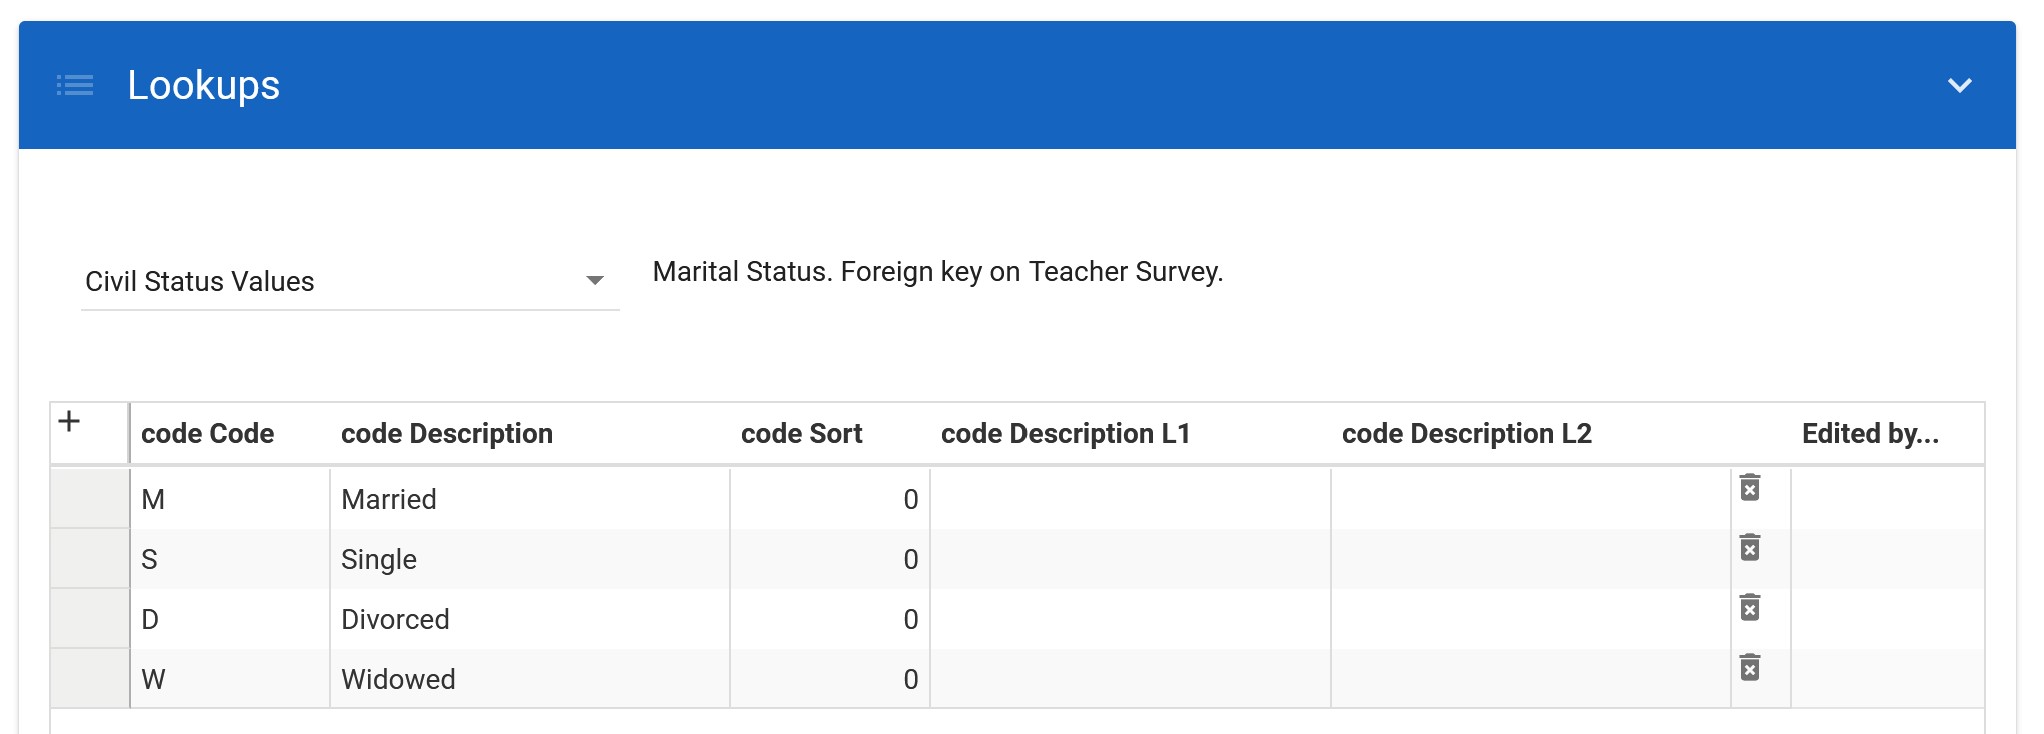
An example of a simple one would be as follows. A simple list of marital status. Most are like this.
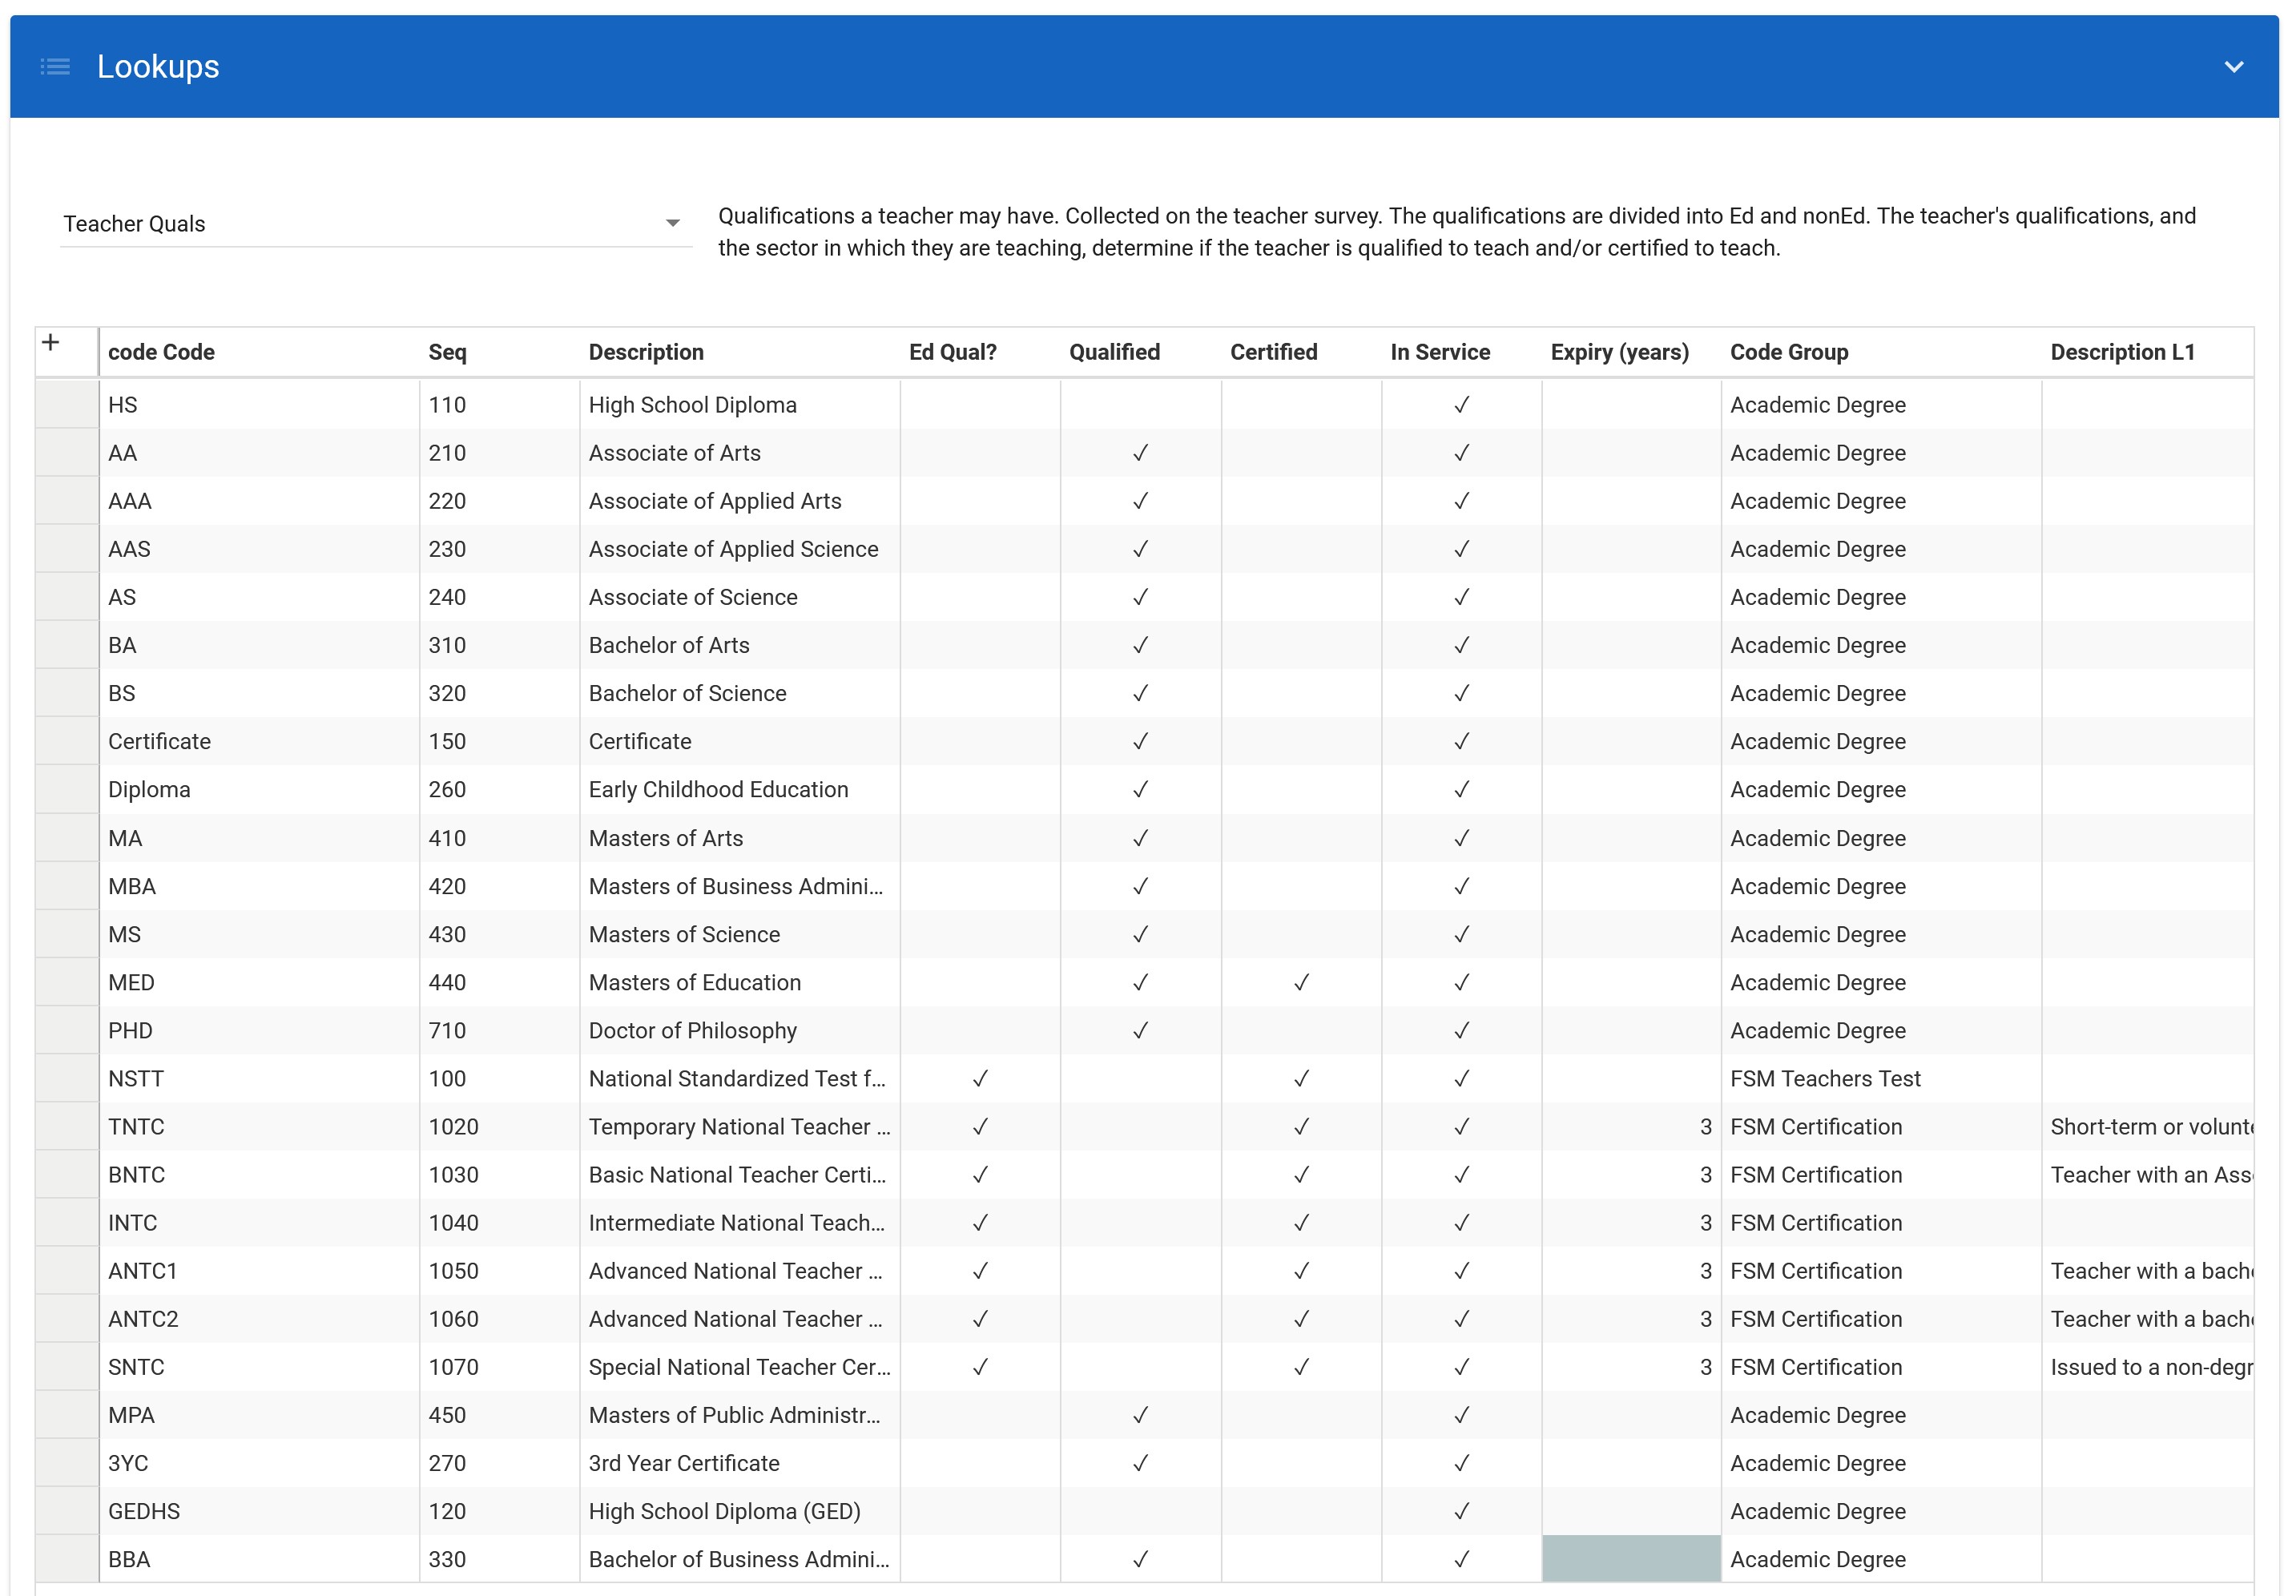
An example of a more advanced lookup is shown below. A list of types of teacher qualifications containing other meta data about the qualification (e.g. whether the qualification qualifies the teacher to teach, whether it is something that expires, etc.) Usually more details will be included directly there in the user interface.
Users and Groups
The Users and Groups and Access Control framework in the Pacific EMIS is custom tailored to the application modules. It currently supports two types of users: Email users and Active Directory users.
When creating a user:
- If the user name is an email, this is an “Identity” account, and the email is the same as the user name. In other words, this is a plain email user.
- If the user name is not an email, then the record represents an Active Directory group. An email is required: so set it to <name>@<context>.org (e.g. PNIUsers@fedemis.org; no emails will ever get sent to his address.). When creating a non-email user it becomes an Active Directory group and users of the active directory are the users of the system which can then be assigned to the groups.
Both types of users function in the same manner. The one difference is that when using the Active Directory the users are managed in the Active Directory and assigned to groups with the access controls managed here in the Pacific EMIS System Admin → Users and Groups.
Creating new plain email users
Creating new plain email users is done by going to the System Admin → Users and Groups sub menu item and clicking on the '+' sign as shown below.

At the minimum you will need to enter the user email, the menu key and all permissions for that user. The user below is an example of a teacher. Then click save.

The user should receive an email as shown below. Advise users should look in their junk box if they don't receive it within a few minutes. User should click on Complete Registration.

Then set a strong password following the shown rules and click on Set your password.

You should get the following welcome message.

And then be redirected and logged in as your new user as shown below outlined in red rectangle.

Creating users/groups with special filters
The Pacific EMIS supports a domain and app specific type of user that can be used to restrict access by
- District (e.g. State, Province, Islands and Atolls)
- Authority (who manages the school)
- Schools
Those filters are useful for example to restrict access to managers of all schools in a district, all schools managed by some authority or by individual schools. They all work the same. Users and groups are create just like previous shown with the only difference of setting the filter. As an example, we will create a user for a data manager for the state of Yap. This user should be able to read, write and administrator all data but only for the state of Yap. This would be done as shown below.

State Audit
Rebuild Warehouse
Professional Data Analysis, Reports and Publications
The Pacific EMIS offers a variety of means for data analysis, reports and publications. They range from very simple to use to highly advanced requiring advanced data analysis skills. The methods are summarized below.
| Type | Easy of Use | Flexibility |
|---|---|---|
| Pre-built Reports | Easy | More rigid. Users use reports as they are provided directly in the Pacific EMIS web UI. JasperReport and Microsoft SQL Reporting Services are supported with mostly JasperReports provided and tested. |
| Pre-built Dashboards | Easy | More rigid. Users make use of the data analysis dashboards as they are provided directly in the Pacific EMIS web UI. |
| Custom Reports | Moderate | More flexible. User with SQL and JasperReports (or MS SQL Reporting Services) skills can build new or modify existing reports with possibility to access them either from the JasperReports Server or integrate them directly in the Pacific EMIS Web UI following some simple convention. |
| Flexible Excel/Word Reports | Moderate | More flexible, user with data analysis, excel and a bit of SQL skills can build any types of report or presentation imaginable. Pull data in excel and link it to MS Word or Power Point presentation. |
| Custom Dashboards | Advanced | Users with advanced SQL, C#, TypeScript, Angular and Data Analysis skills could expand on the existing dashboards provided in the Pacific EMIS out-of-the-box. Since this project is open source the custom dashboartds are required to be released as open source. |
| External Tools | Advanced | Users with advanced SQL and/or data analysis skills could connect to the RESTful API or use excel data exports to use with their favourite tools (e.g. Python/Pandas/Dash, R, Tableau, Power BI, SPSS, SAS) |
Further notes on the Flexible Excel/Word Reports type of reporting. We have a combination of tools (e.g. Data Publishing Toolkit, Multi-part Word Document) and practices for publishing data into Excel tables and pivot tables. This forms the basis for the construction of documents such as Annual Statistics Digest, etc. These connection are direct connections to SQL Server using Excel’s OLEDB capacity. It is possible to establish SQL connections across the WAN, but this entails some careful security setup to allows users through a firewall to reach the SQL Server. In particular, a “read only” user. In order to support users who do not have access to SQL (i.e. either across their LAN, or across the WAN) to access data in Excel we are building support for new options. This would allow more options for remote hosting, and also for a broader set of users to have access to Excel.
The three planned options are available in various levels of maturity and the table below shows the comparative strength and weaknesses of the 3 approaches:
| Mode | Connection | Refreshable? | Flexibility | Distribution | Maturity |
|---|---|---|---|---|---|
| Direct SQL / DPT | SQL connection | Yes | Any Sql query. | Typically built by the end user using DPT | Tried and tested for years |
| Power Query | Web portal connection | Yes | Restricted to REST endpoints. | Curated workbooks would be distributed to relevant users | In development but got working prototypes |
| Dynamic | Web portal connection | No | Restricted to REST endpoints. Since this cannot be refreshed, you would not build a lot of additional material into such a workbook. | Can be built into web interface - dynamically created on request | In development but got working prototypes |
All three options will be documented in the following sections.
Direct SQL / DPT
This is the technique currently the most widely used by adopting countries. Excel workbooks setup data connections direction to the SQL server.
- How you can access the data from excel is documented at Pacific EMIS Data Warehouse
- How to use DPT (which is optional) is documented at Data Publisher's Tooltik
- How to work with multi word documents is documented at Multi-part Word Document
Power Query
Power query extends Excel’s ability to access data from relational sources with the ability to extract, transform and load data from a wide variety of sources including http rest end points.
Dynamic Workbooks
Currently this design is prototyped:
<rest endpoint>?xl
Add the xl option to the query string. This will return the data from the rest endpoint in Excel, as a table and pivot table.
<rest endpoint>?”xl=<file name>.xlsx
If a filename including extension is supplied, the returned Excel has this exact name.
<rest endpoint>?”xl=<file token>
A name is created from the token, in this form:
<context> <file token> <yyyy-mm-dd>.xlsx
Public Data Dissemination
Aside from data about individuals, just about all other data benefits from being public for a number of reasons:
- Transparency and Accountability: Open data fosters transparency, holding organizations and governments accountable.
- Innovation and Collaboration: Public data fuels innovation, enabling collaboration among researchers, entrepreneurs, and developers.
- Informed Decision-Making: Accessible data empowers individuals and organizations for better decision-making.
- Citizen Engagement: Open data encourages citizen participation and engagement in public affairs.
- Economic Growth: Data availability stimulates economic growth, fostering entrepreneurship and creating jobs.
- Research Advancement: Open data accelerates research and scientific discoveries across various fields.
- Public Services Improvement: Governments utilize open data to enhance public services and address societal challenges.
- Cross-Sector Collaboration: Open data facilitates collaboration between sectors to address complex issues.
- Community Empowerment: Open data enables communities to address local challenges and actively participate in development.
- Accountable Governance: Open data supports accountable governance, allowing citizens to monitor government activities and foster trust.
The Pacific EMIS supports a number of ways to disseminate data in a timely manner that KEMIS does not yet fully adopt. They are summarized in the table below:
| Method | Description | Time to Access | Access Difficulty |
|---|---|---|---|
| Publications | Often the most official and slowly curated sources of data. | Longest time. Requires more efforts in collecting, validating, preparing and publishing and can come sometime years after. | Easy. Typically through downloadable PDF documents. |
| Mobile App | Download all data and view analysis on your phone. | Fast. New data immediately available. | Easy. Download the Pacific Open Education Data app on your Android or iPhone |
| Public Login | The web application supports a public login to view all dashboards and download excel data exports. | Fast. New data immediately available. | Easy. Login the country EMIS public profile from login page. |
| REST API | Access the raw data through special web requests in formats such as JSON and XML. | Fast. New data immediately available. | Difficult. Typically used by developers or researching with programming skills |
A word of caution. The pacific island countries faces unique challenges making it hard to continuously improve the quality of data. Accessing the data any of the fast methods has the caveat that it has had less time for scrutiny and possible remediation. So it should always be used with care and we always appreciate any apparent issue brought to our attention so we can work to fix them.
Each of these methods will have a sub-sections here with additional documentation.
References
[BhandariStd2023] Bhandari, P. (2023, January 20). How to Calculate Standard Deviation (Guide) | Calculator & Examples. Scribbr. Retrieved February 27, 2023, from https://www.scribbr.com/statistics/standard-deviation/
[BhandariVariance2023] Bhandari, P. (2023, January 18). How to Calculate Variance | Calculator, Analysis & Examples. Scribbr. Retrieved February 23, 2023, from https://www.scribbr.com/statistics/variance/
[BrownDI2020] Brown, J. (2020, February 26), What is discrimination index and its formula?, Retrieved February 26, 2020, from https://knowledgeburrow.com/what-is-discrimination-index-and-its-formula/
[UWItemAnalysis] University of Washington, Office of Educational Assessment, Retrieved from, https://www.washington.edu/assessment/scanning-scoring/scoring/reports/item-analysis/