Table of Contents
Pacific Exams Module
This guide details the inner workings of the Pacific EMIS Exams module standard-based assessment component here after referred to as simply the “Exam Module”.
Introduction
The Exam Module is capable of analysis across many different dimensions including:
- Exams classification hierarchy
- Exam (aka. Whole Exam or highest level)
- Standards
- Benchmarks
- Indicators (lowest level with narrowest focus on evaluation)
- School disaggregations
- District (e.g. State, Island, Province, etc.)
- Authority (e.g. Church of Chris, SDA Church, Private Organizations)
- Authority Group (e.g. public/private)
- Region (e.g. Urban/Rural)
- Student disaggregations
- Gender
- Special Education
And the data can be processed in the following ways:
- Candidate Count (the most common and familiar method. In essence the percentage of student in each levels of achievements)
- Indicator Count (aka. Level Count. In essence the percentage of indicators in each levels of achievements. This method was the primary one used for benchmarks, standards and whole test in the SOE Assessment commonly used in Pacific Island countries)
- Weighted Indicator Count (Similar to the Indicator count but using a more advanced weighted technique, not used by anyone at the moment)
Both the Candidate Count and Indicator Count calculation techniques will be discussed in details below. However, some concepts are common to all and discussed first.
Assessment Raw Data Background
Regardless of how data is processed some concepts always apply.
Subject Areas, Standards and Benchmarks
Exams (aka. assessments) are typically given at various stages of a student's education life cycle (e.g. Grade 3, Grade 6, Grade 8, Grade 12, etc.) and on various subject areas (e.g. English, Local Language, Mathematics, Sciences). The subjects are then organized down further into standards which are organized down into benchmarks and finally organized down into indicators all of which students are assessed on. A simplified version of this hierarchical structure is depicted below in the Grade 3 Mathematics subject area.
- Standard 3.1: Number Sense
- Benchmark 3.1.1: Use place value understanding and properties of operations to perform …
- Indicator 3.1.1.1: Use base-ten blocks to count, read and write numbers to …
- Indicator 3.1.1.2: Understand and use properties of multiplication (e.g. commutative property …
- Indicator 3.1.1.3: Divide with tables of 6, 7, 8, and 9 using models …
- Standard 3.2: Geometry and measurement concepts.
- Benchmark 3.2.1 Solve problems of time and temperature. apply knowledge to real world problems.
- Indicator 3.2.1.1: Tell time to the minute. Read time on a digital clock…
- Benchmark 3.2.2 Find the area and perimeter of figures.
- Indicator 3.2.2.1: Understand the meaning of area. Use square units to find
By structuring subject areas as above, it is then possible to assess–as a group or individually–how students fare on large subject areas concepts (e.g. Standard 3.1 Number Senses) and also further drill-down into standards of interest by looking into the standard's benchmarks (e.g. Benchmark 3.1.1, etc.). While it is possible to drill-down even further into the benchmarks' indicators it is not considered useful in practice. Indicators can be considered more as lower level organizational bins for the exam's items (questions).
Exam Items
To assess students a number of items (questions) make up an exam. This can be anywhere from 40 items to 72 items, but it could be more or less. There is no hard rule on the number of items but typically it will be a multiple of 4 since the results are usually compiled into 4 levels of achievement discussed in the next section. And since the analysis is possible all the way down to indicators it is usually required to have 4 items minimum to assess a particular indicator. So for the simplified example above the whole test could have 20 items (a small exam).
- Standard 3.1: Number Sense
- Benchmark 3.1.1: Use place value understanding and properties of operations to perform …
- Indicator 3.1.1.1: Use base-ten blocks to count, read and write numbers to … [4 ITEMS]
- Indicator 3.1.1.2: Understand and use properties of multiplication (e.g. commutative property … [4 ITEMS]
- Indicator 3.1.1.3: Divide with tables of 6, 7, 8, and 9 using models … [4 ITEMS]
- Standard 3.2: Geometry and measurement concepts.
- Benchmark 3.2.1 Solve problems of time and temperature. apply knowledge to real world problems.
- Indicator 3.2.1.1: Tell time to the minute. Read time on a digital clock… [4 ITEMS]
- Benchmark 3.2.2 Find the area and perimeter of figures.
- Indicator 3.2.2.1: Understand the meaning of area. Use square units to find [4 ITEMS]
We will call the items following this schema: ITEM_X_XXXX (where X is the item number and XXXX is the indicator assessed by the item). For example, assessing the Indicator 3.2.1.1 could be done with the four following exam items (questions).
- ITEM_1_3211: A first multiple choice question to assess Indicator 3.2.1.1
- ITEM_2_3211: A second multiple choice question to assess Indicator 3.2.1.1
- ITEM_3_3211: A third multiple choice question to assess Indicator 3.2.1.1
- ITEM_4_3211: A fourth multiple choice question to assess Indicator 3.2.1.1
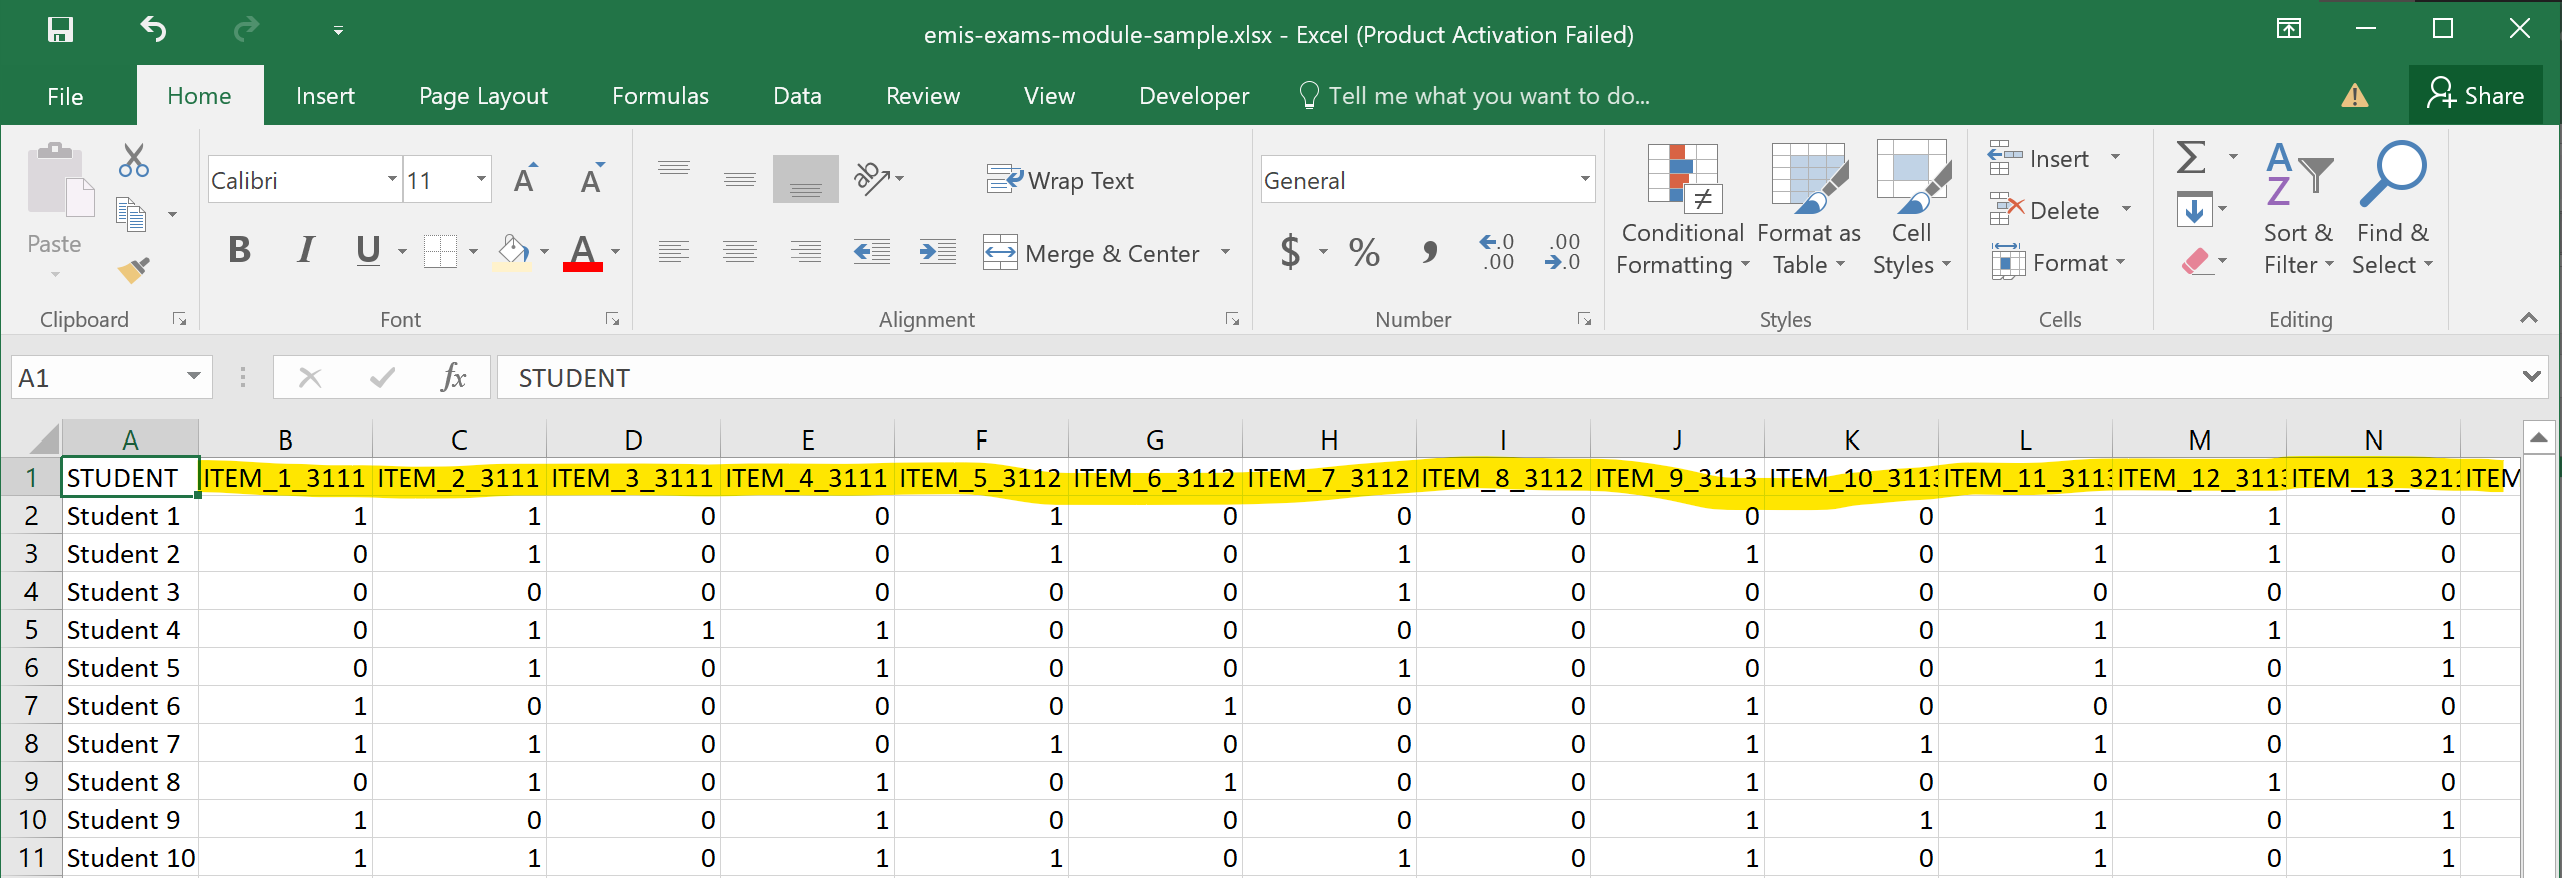
The exams will be made up of 20 such items. The resulting raw data file could look like below where 0 is an incorrectly answered item and 1 is a correctly answered item.
Levels of Achievement
As mentioned, students are assessed by analyzing their scores. The results are then based on 4 levels of achievement. The exact naming varies by countries but essentially are the following:
- Level 1: the lowest performance level (below minimum competence)
- Level 2: the second lowest performance level (approaching/developing into minimum competence)
- Level 3: the second highest performance level (approaching competence)
- Level 4: the highest performance level (fully competent performing at advanced level)
For simplicity, the levels of achievement will be referred to as simply Level 1, Level 2, Level 3 and Level 4 for the remaining of this document.
Analysis Method - Candidate Count
The candidate count analysis can be done at various levels including:
- By individual candidate (student)
- By exam (whole test)
- By standards
- By benchmarks
- By indicators
Regardless of the level at which the analysis is performed, the methodology is the same. You take the total number of items and you divide by 4 to get your “cut-offs”. For example, if there are 4 items (e.g. analysis for an indicator) you have the following:
- 0 or 1 items correct out of 4 ⇒ Level 1
- 2 items correct out of 4 ⇒ Level 2
- 3 items correct out of 4 ⇒ Level 3
- 4 items correct out of 4 ⇒ Level 4
If you have 40 items (e.g. analysis for a whole test) you have the following:
- 0 to 10 items correct out of 40 ⇒ Level 1
- 11 to 20 items correct out of 40 ⇒ Level 2
- 21 to 30 items correct out of 40 ⇒ Level 3
- 31 to 40 items correct out of 40 ⇒ Level 4
Let's review the analysis at different levels with examples.
By individual candidate (student)
To get the level of achievement of an individual you look at all the correct items for the whole test and see where the student falls within the cut-offs. This test has 20 items and thus the cut-offs are as follows:
- 0 to 5 items correct out of 20 ⇒ Level 1
- 6 to 10 items correct out of 20 ⇒ Level 2
- 11 to 15 items correct out of 20 ⇒ Level 3
- 16 to 20 items correct out of 20 ⇒ Level 4
By exam
From our original example we have the exam for Math Grade 3. This exam as 20 items. Therefore the cut-offs are as below:
- 0 to 5 items correct out of 20 ⇒ Level 1
- 6 to 10 items correct out of 20 ⇒ Level 2
- 11 to 15 items correct out of 20 ⇒ Level 3
- 16 to 20 items correct out of 20 ⇒ Level 4
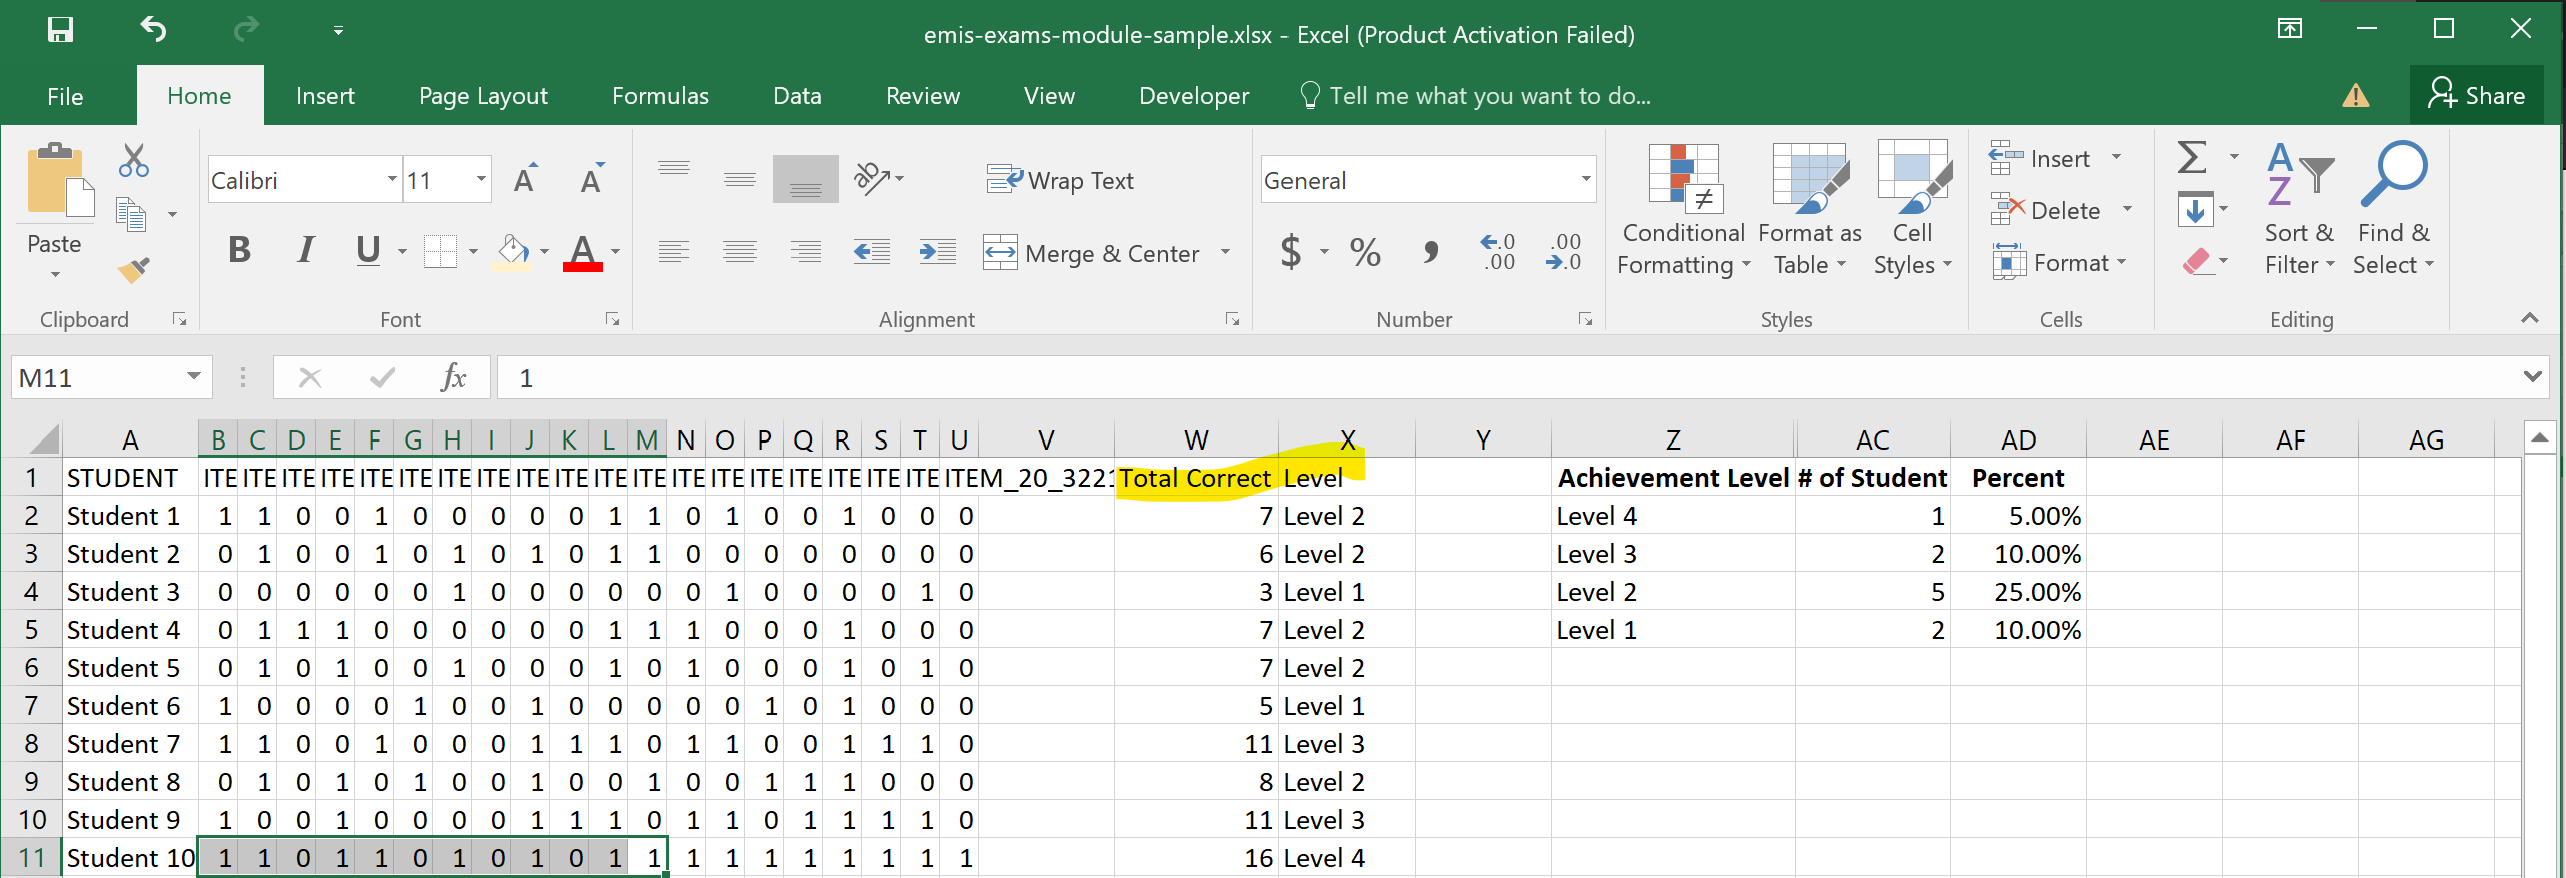
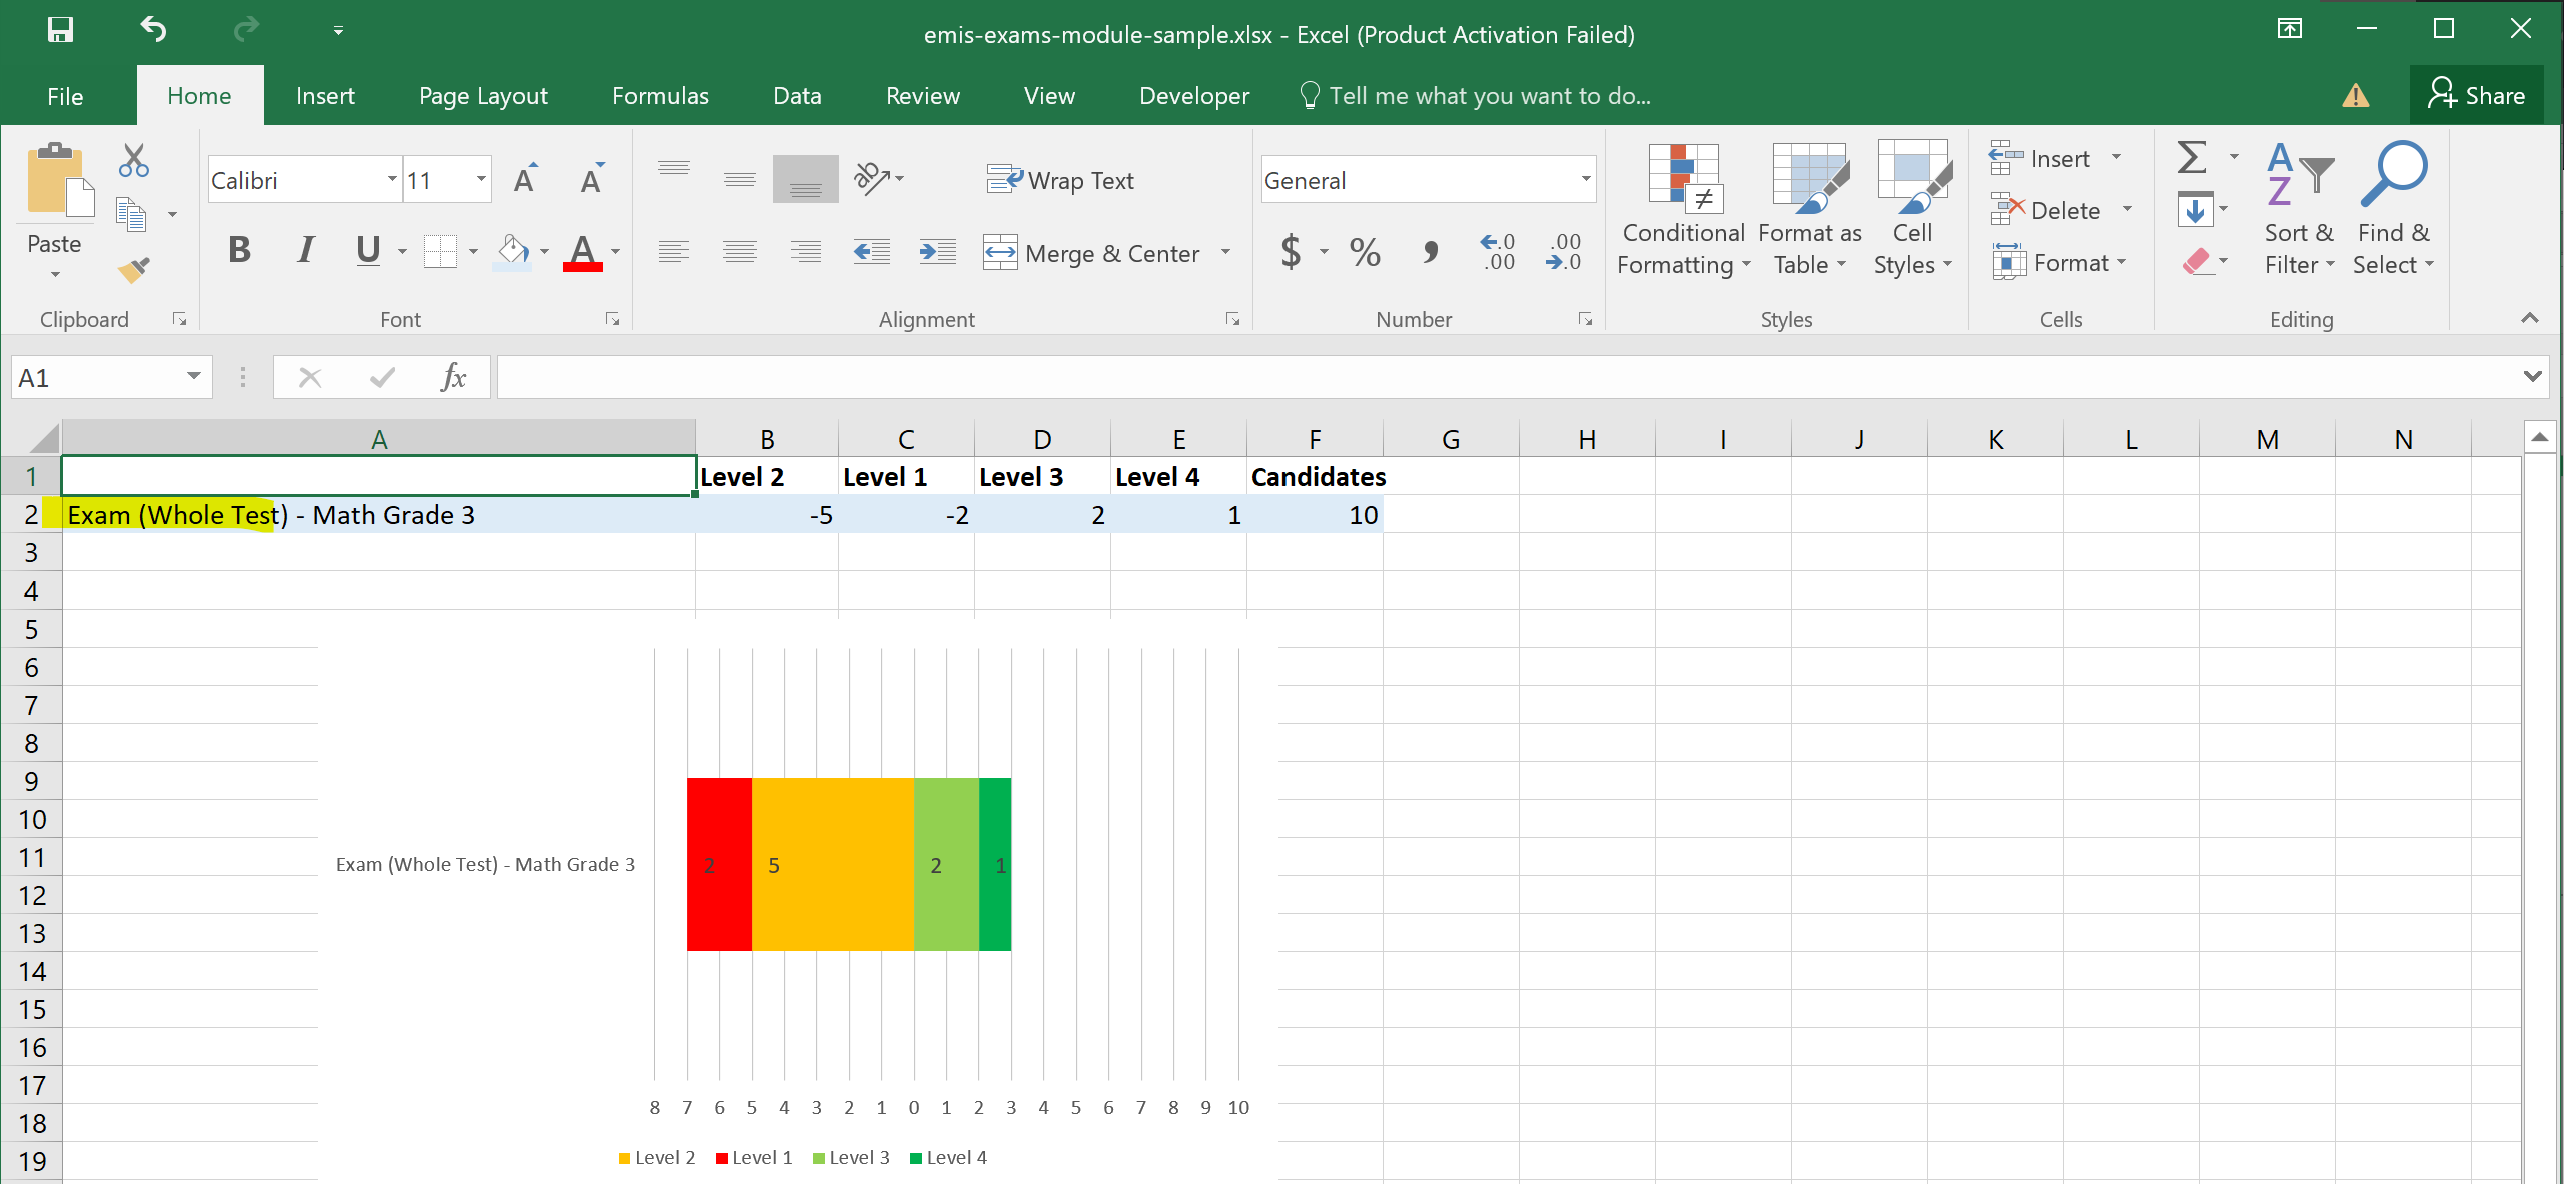
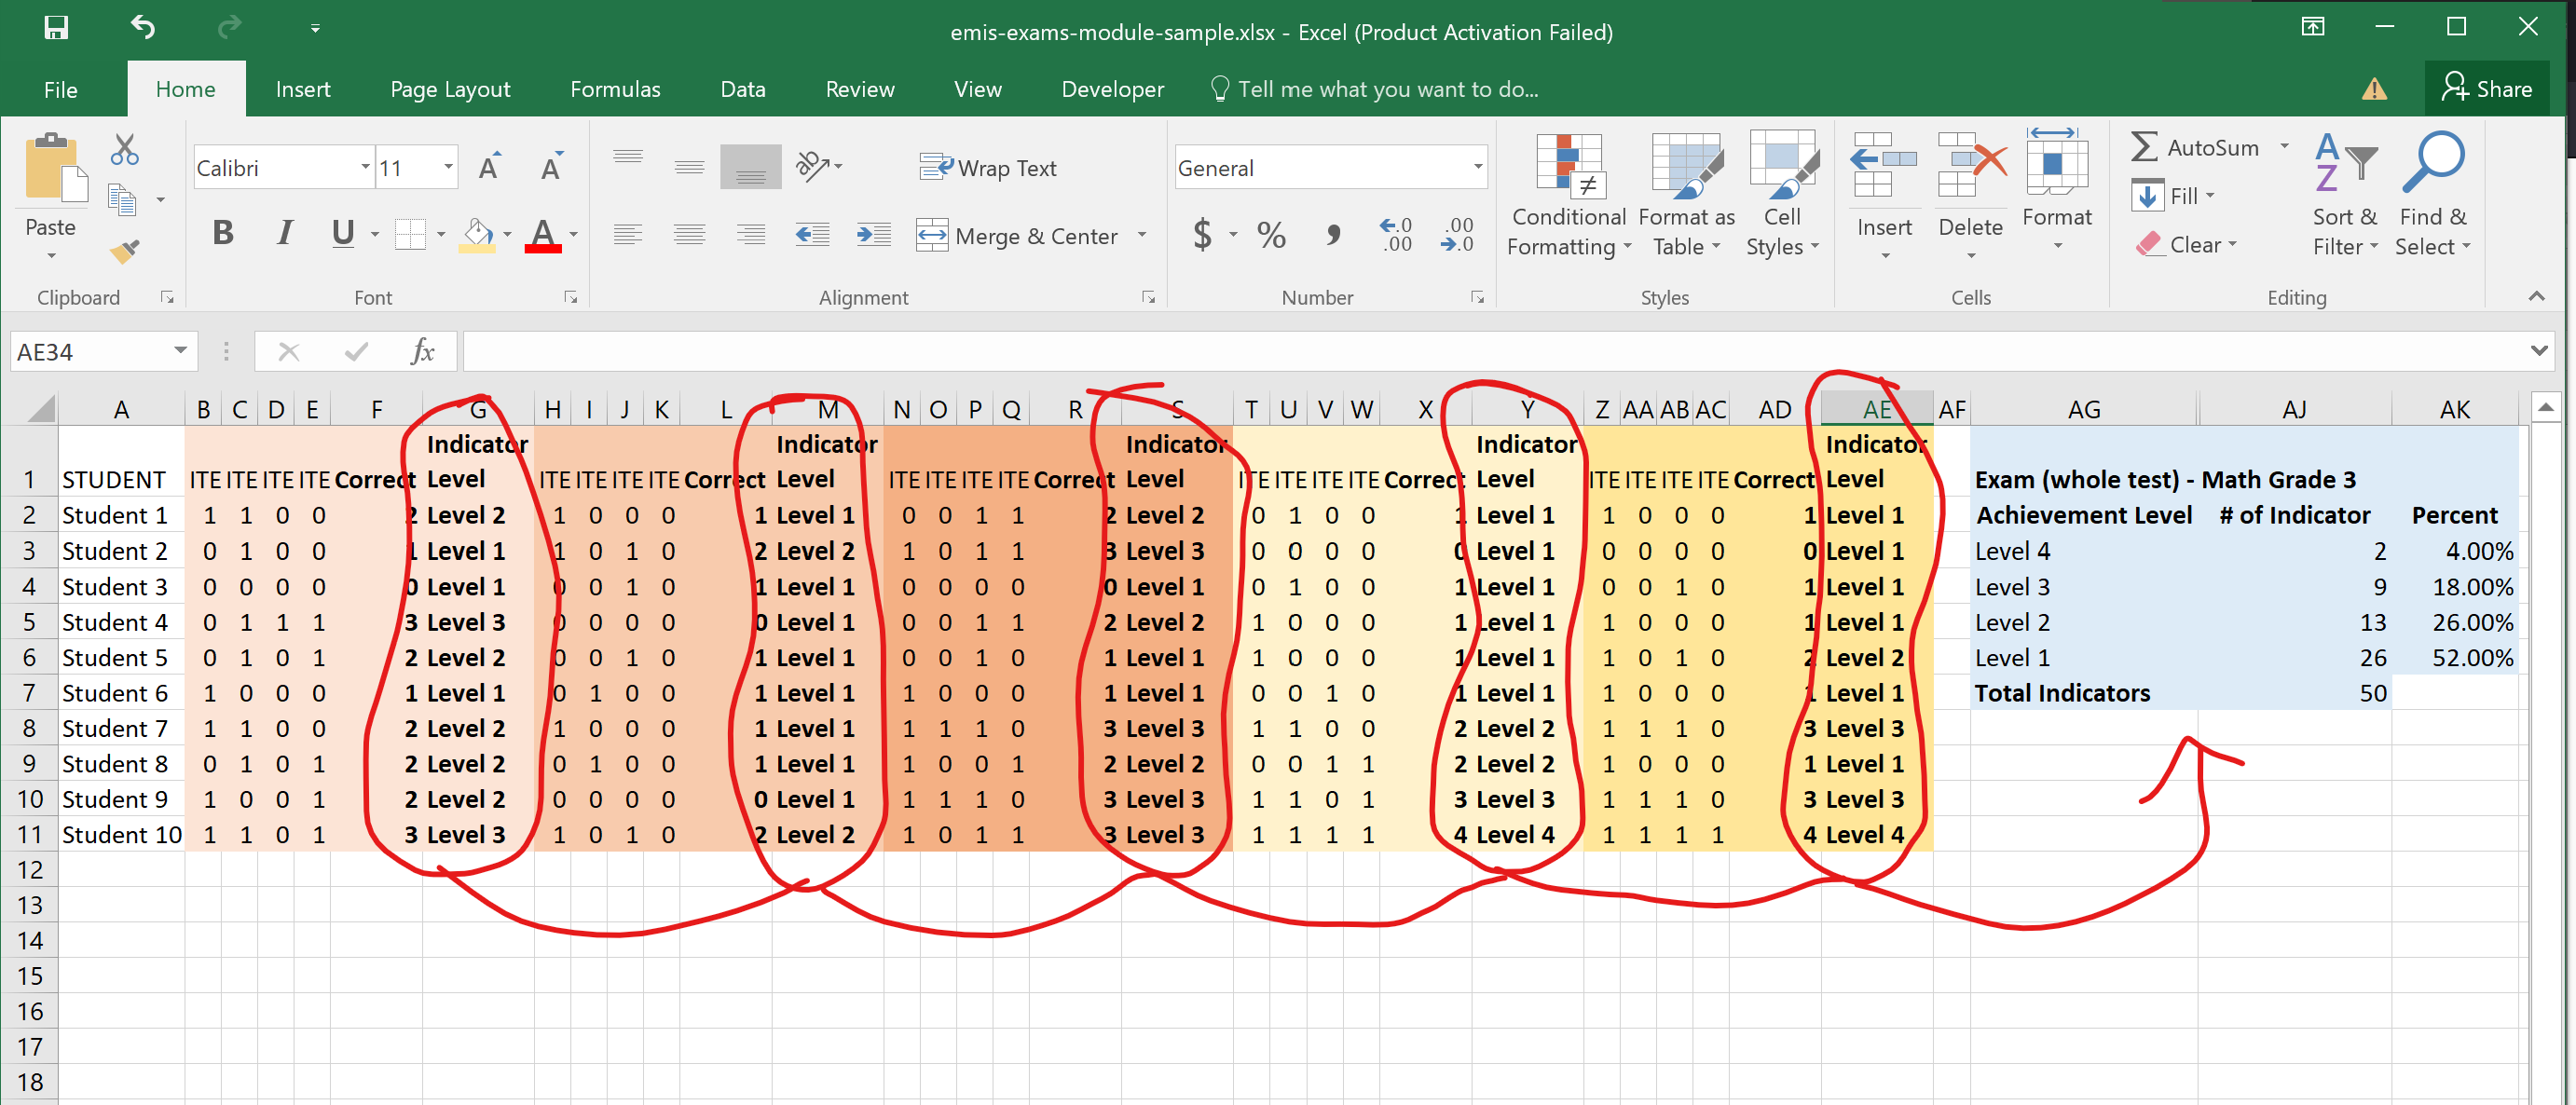
What follows is a illustration of how this analysis would be produced. The items for the whole exams are highlighted in blue (all exam items).
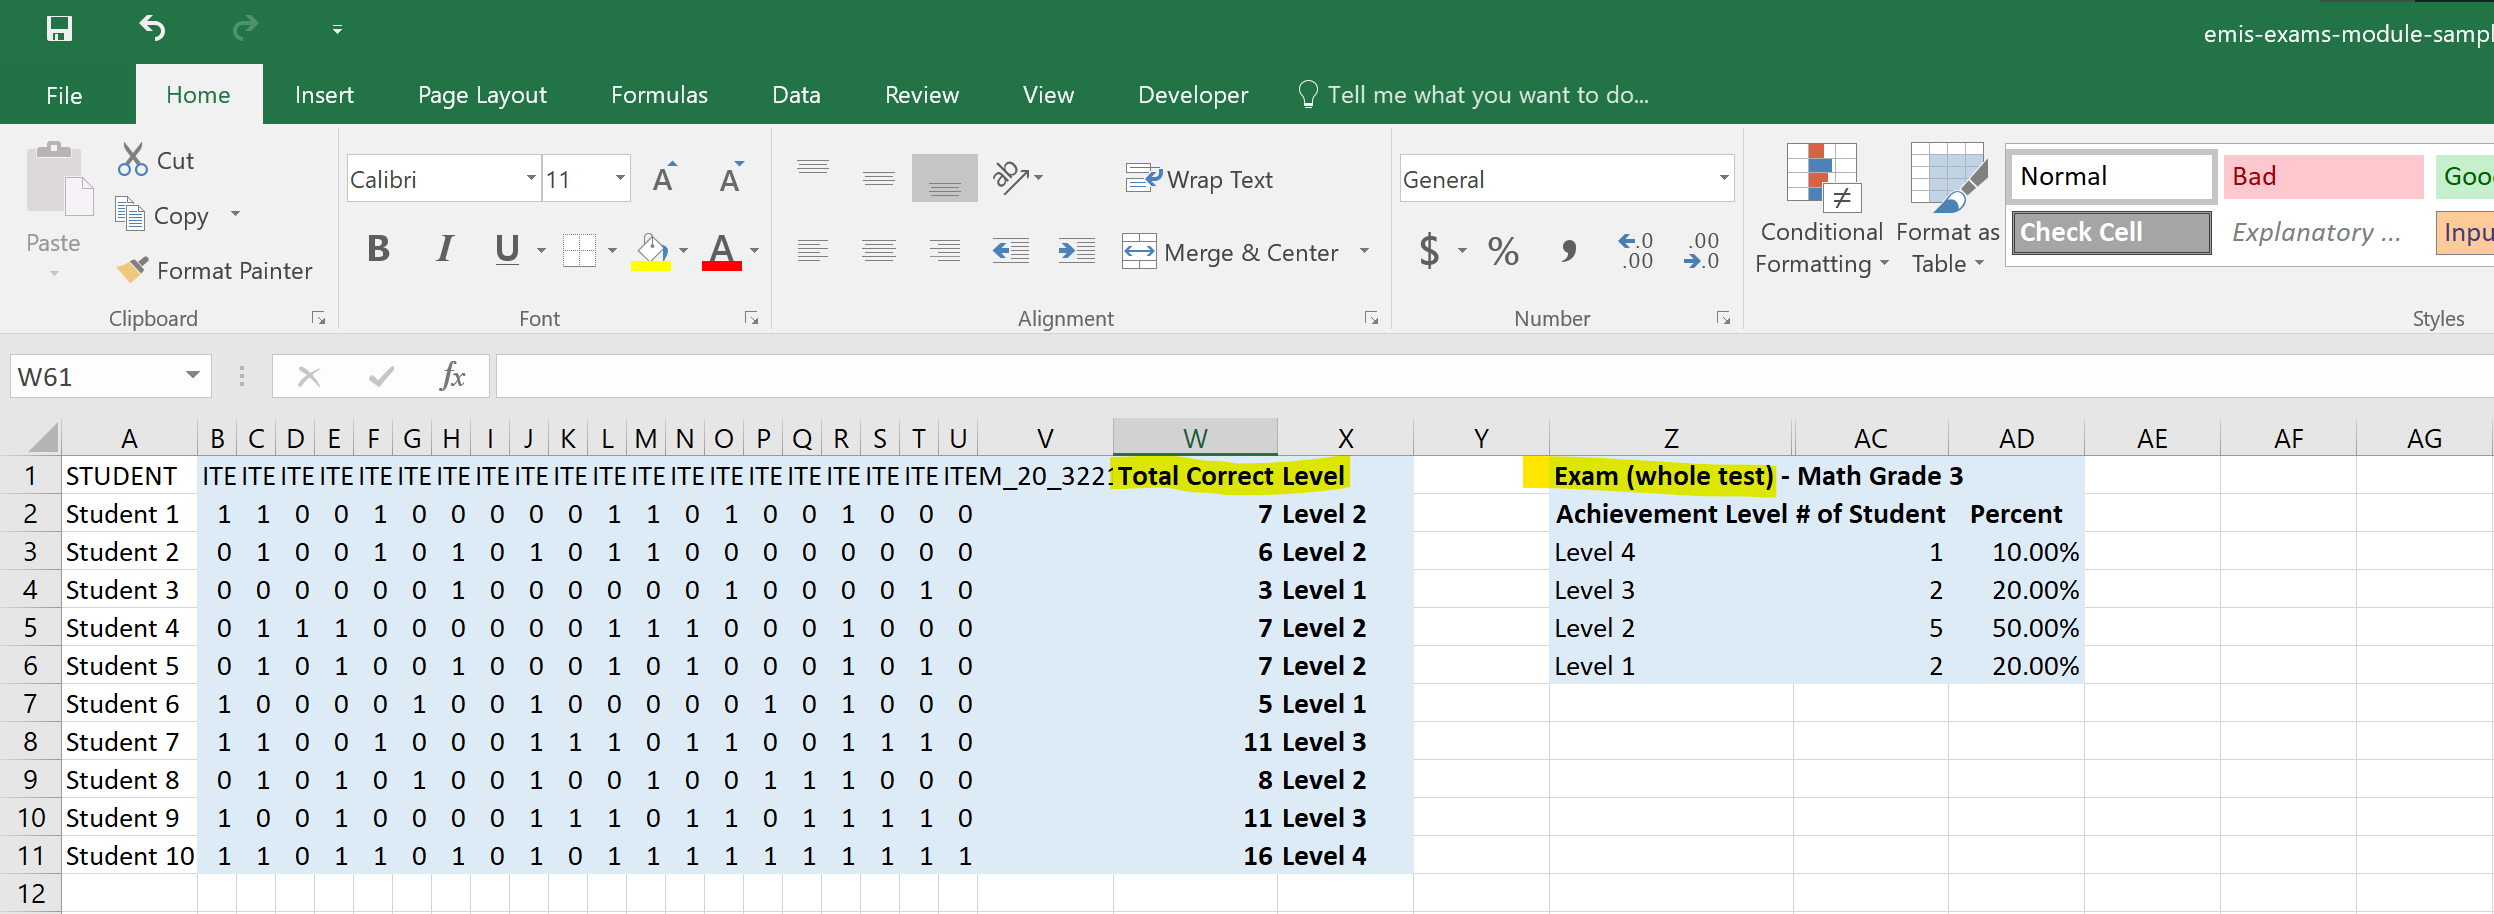
And the resulting chart analysis.
By standards
From our original example we have two standards. And based on the standard's indicators and their items on the exams we know how many items for each of our standards.
- Standard 3.1: Number Sense [12 ITEMS] with the cut-offs as:
- 0 to 3 items correct out of 12 ⇒ Level 1
- 4 to 6 items correct out of 12 ⇒ Level 2
- 7 to 9 items correct out of 12 ⇒ Level 3
- 10 to 12 items correct out of 12 ⇒ Level 4
- Standard 3.2: Geometry and measurement concepts. [8 ITEMS] with the cut-offs as:
- 0 to 2 items correct out of 8 ⇒ Level 1
- 3 to 4 items correct out of 8 ⇒ Level 2
- 5 to 6 items correct out of 8 ⇒ Level 3
- 7 to 8 items correct out of 8 ⇒ Level 4
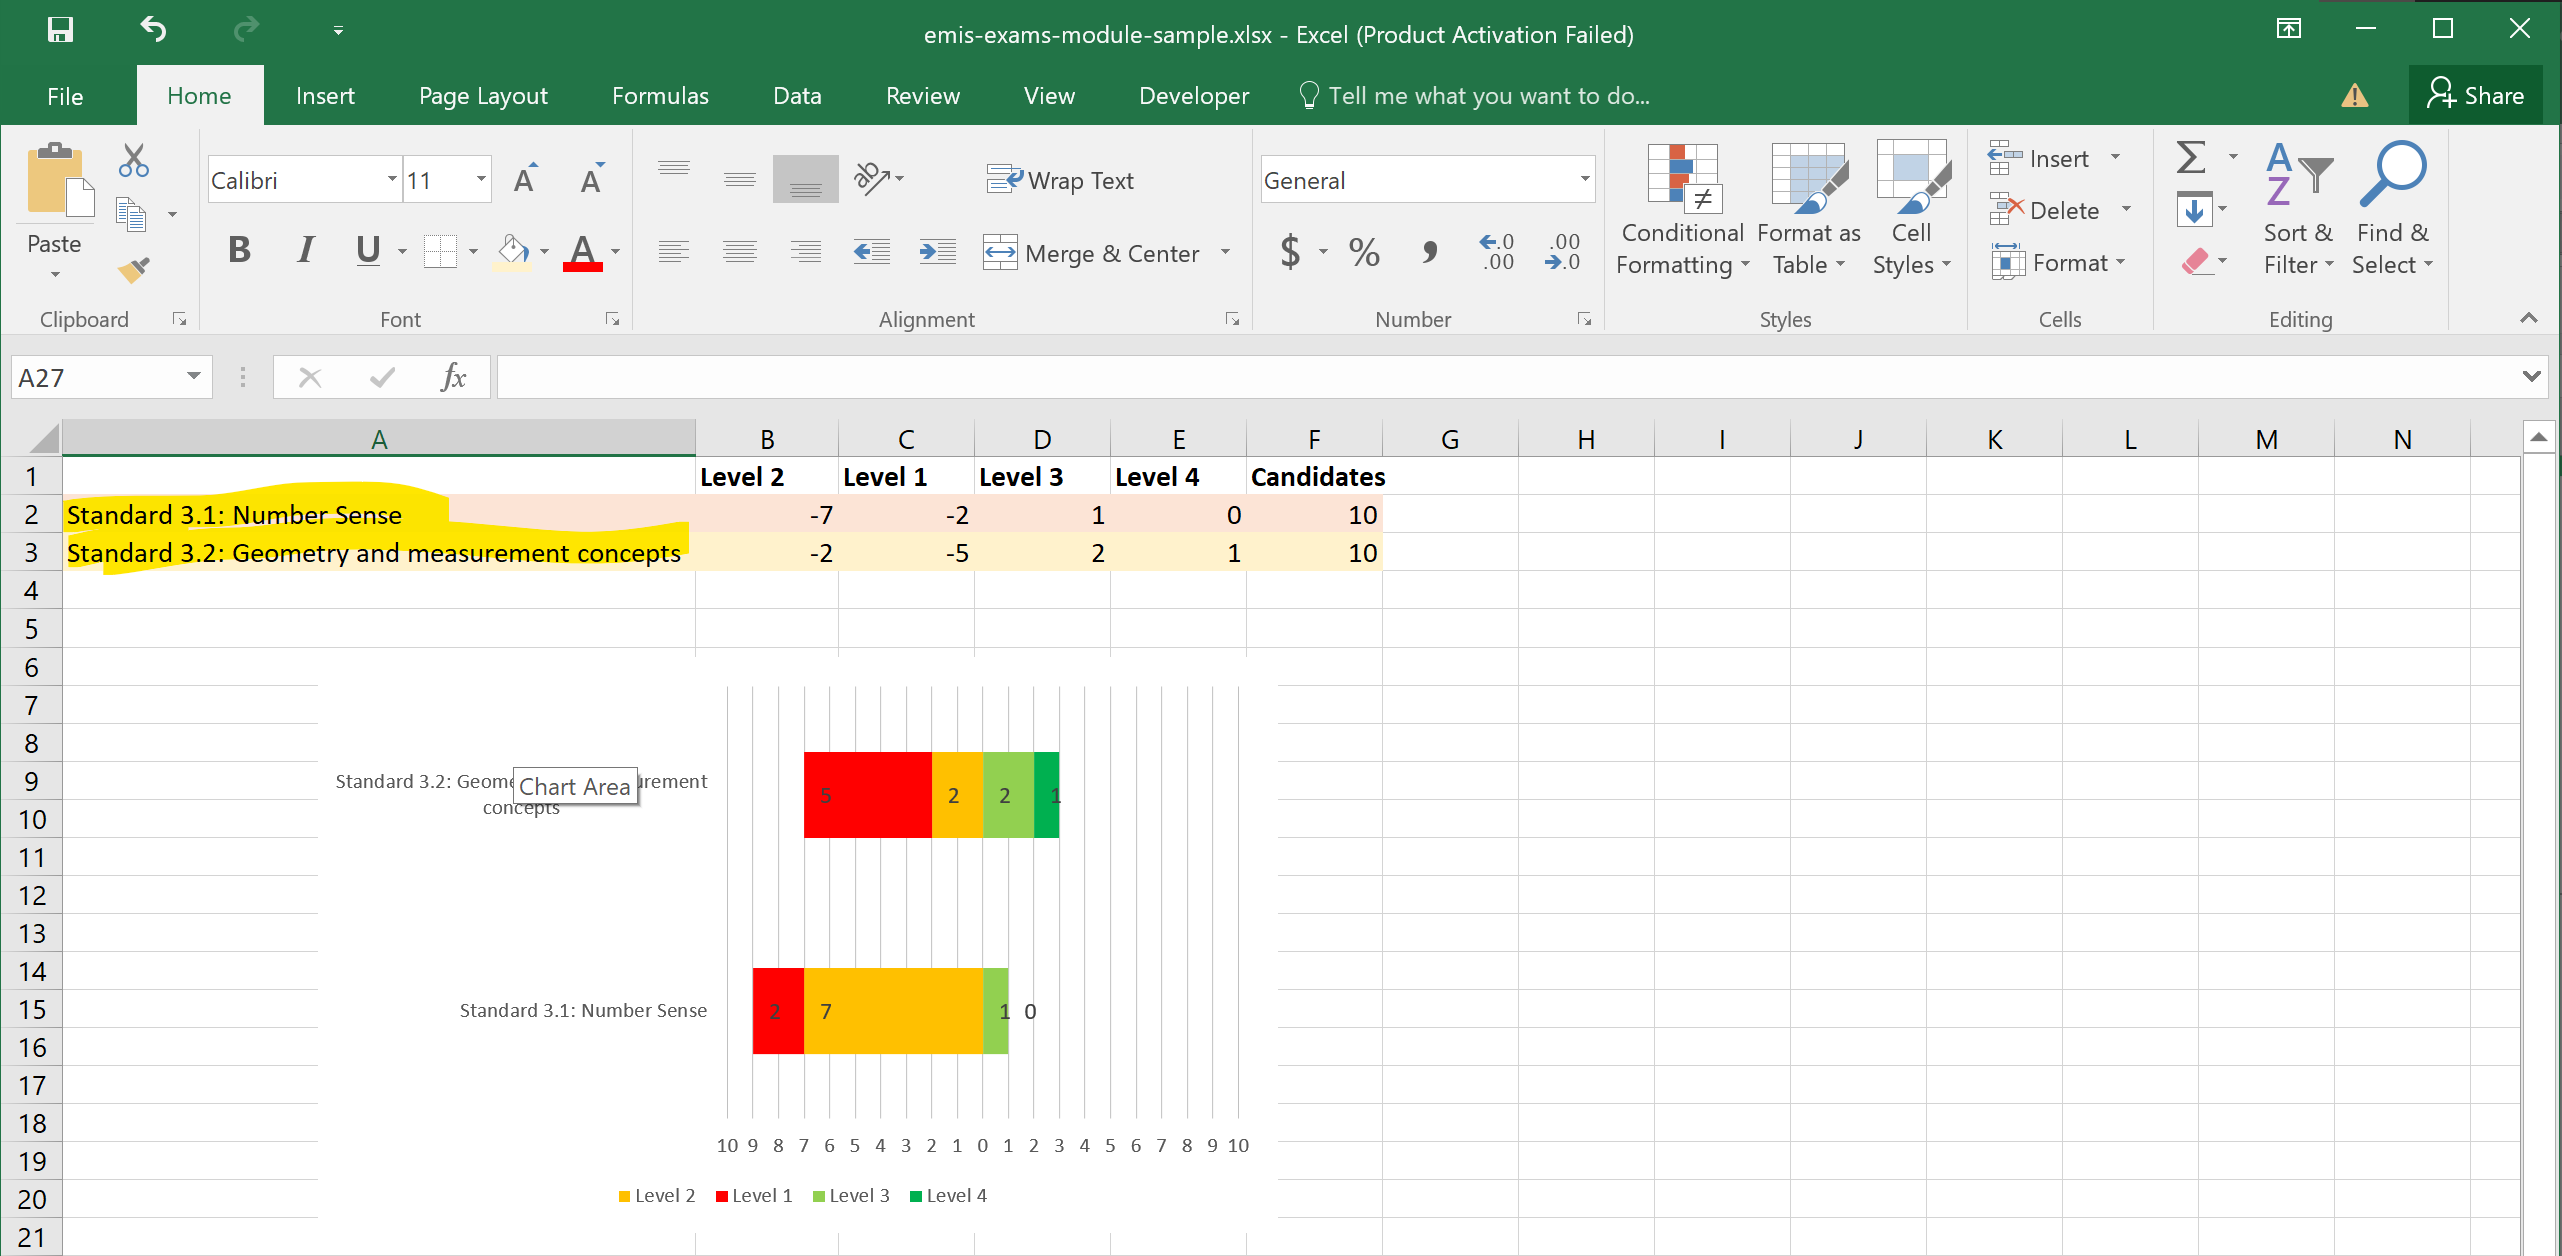
What follows is a illustration of how this analysis would be produced. The items for the two different standards are highlighted in their own respective colors.
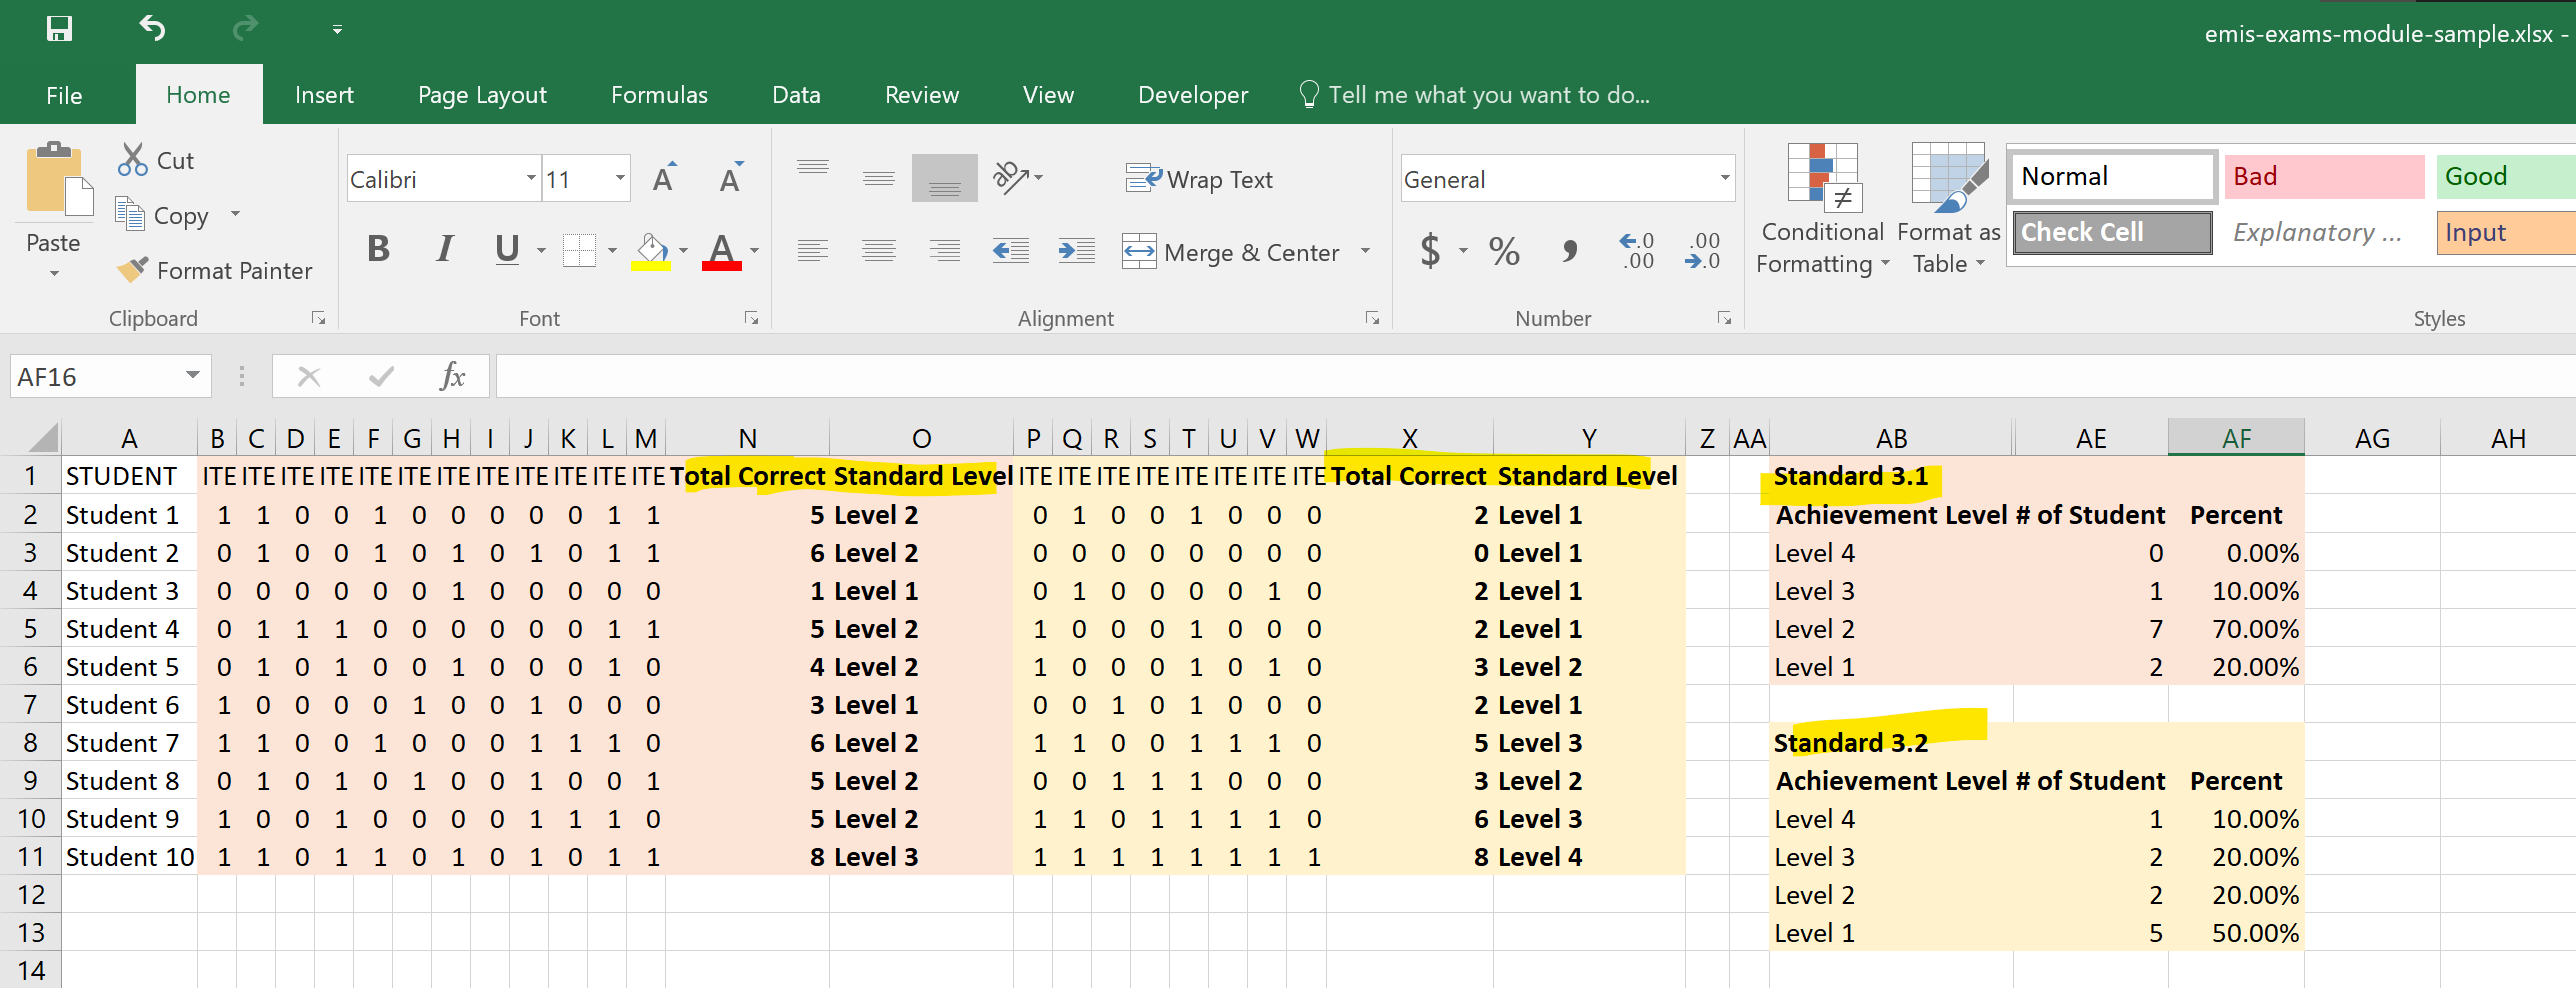
And the resulting chart analysis.
By benchmarks
From our original example we have three benchmarks. And based on the benchmarks' indicators and their items on the exam we know how many items for each of our benchmark.
- Benchmark 3.1.1: Use place value understanding and properties of operations to perform … [12 ITEMS] with the cut-offs as:
- 0 to 3 items correct out of 12 ⇒ Level 1
- 4 to 6 items correct out of 12 ⇒ Level 2
- 7 to 9 items correct out of 12 ⇒ Level 3
- 10 to 12 items correct out of 12 ⇒ Level 4
- Benchmark 3.2.1 Solve problems of time and temperature. apply knowledge to real world problems. [4 ITEMS] with the cut-offs as:
- 0 to 1 items correct out of 4 ⇒ Level 1
- 2 items correct out of 4 ⇒ Level 2
- 3 items correct out of 4 ⇒ Level 3
- 4 items correct out of 4 ⇒ Level 4
- Benchmark 3.2.2 Find the area and perimeter of figures. [4 ITEMS] with the cut-offs as:
- 0 to 1 items correct out of 4 ⇒ Level 1
- 2 items correct out of 4 ⇒ Level 2
- 3 items correct out of 4 ⇒ Level 3
- 4 items correct out of 4 ⇒ Level 4
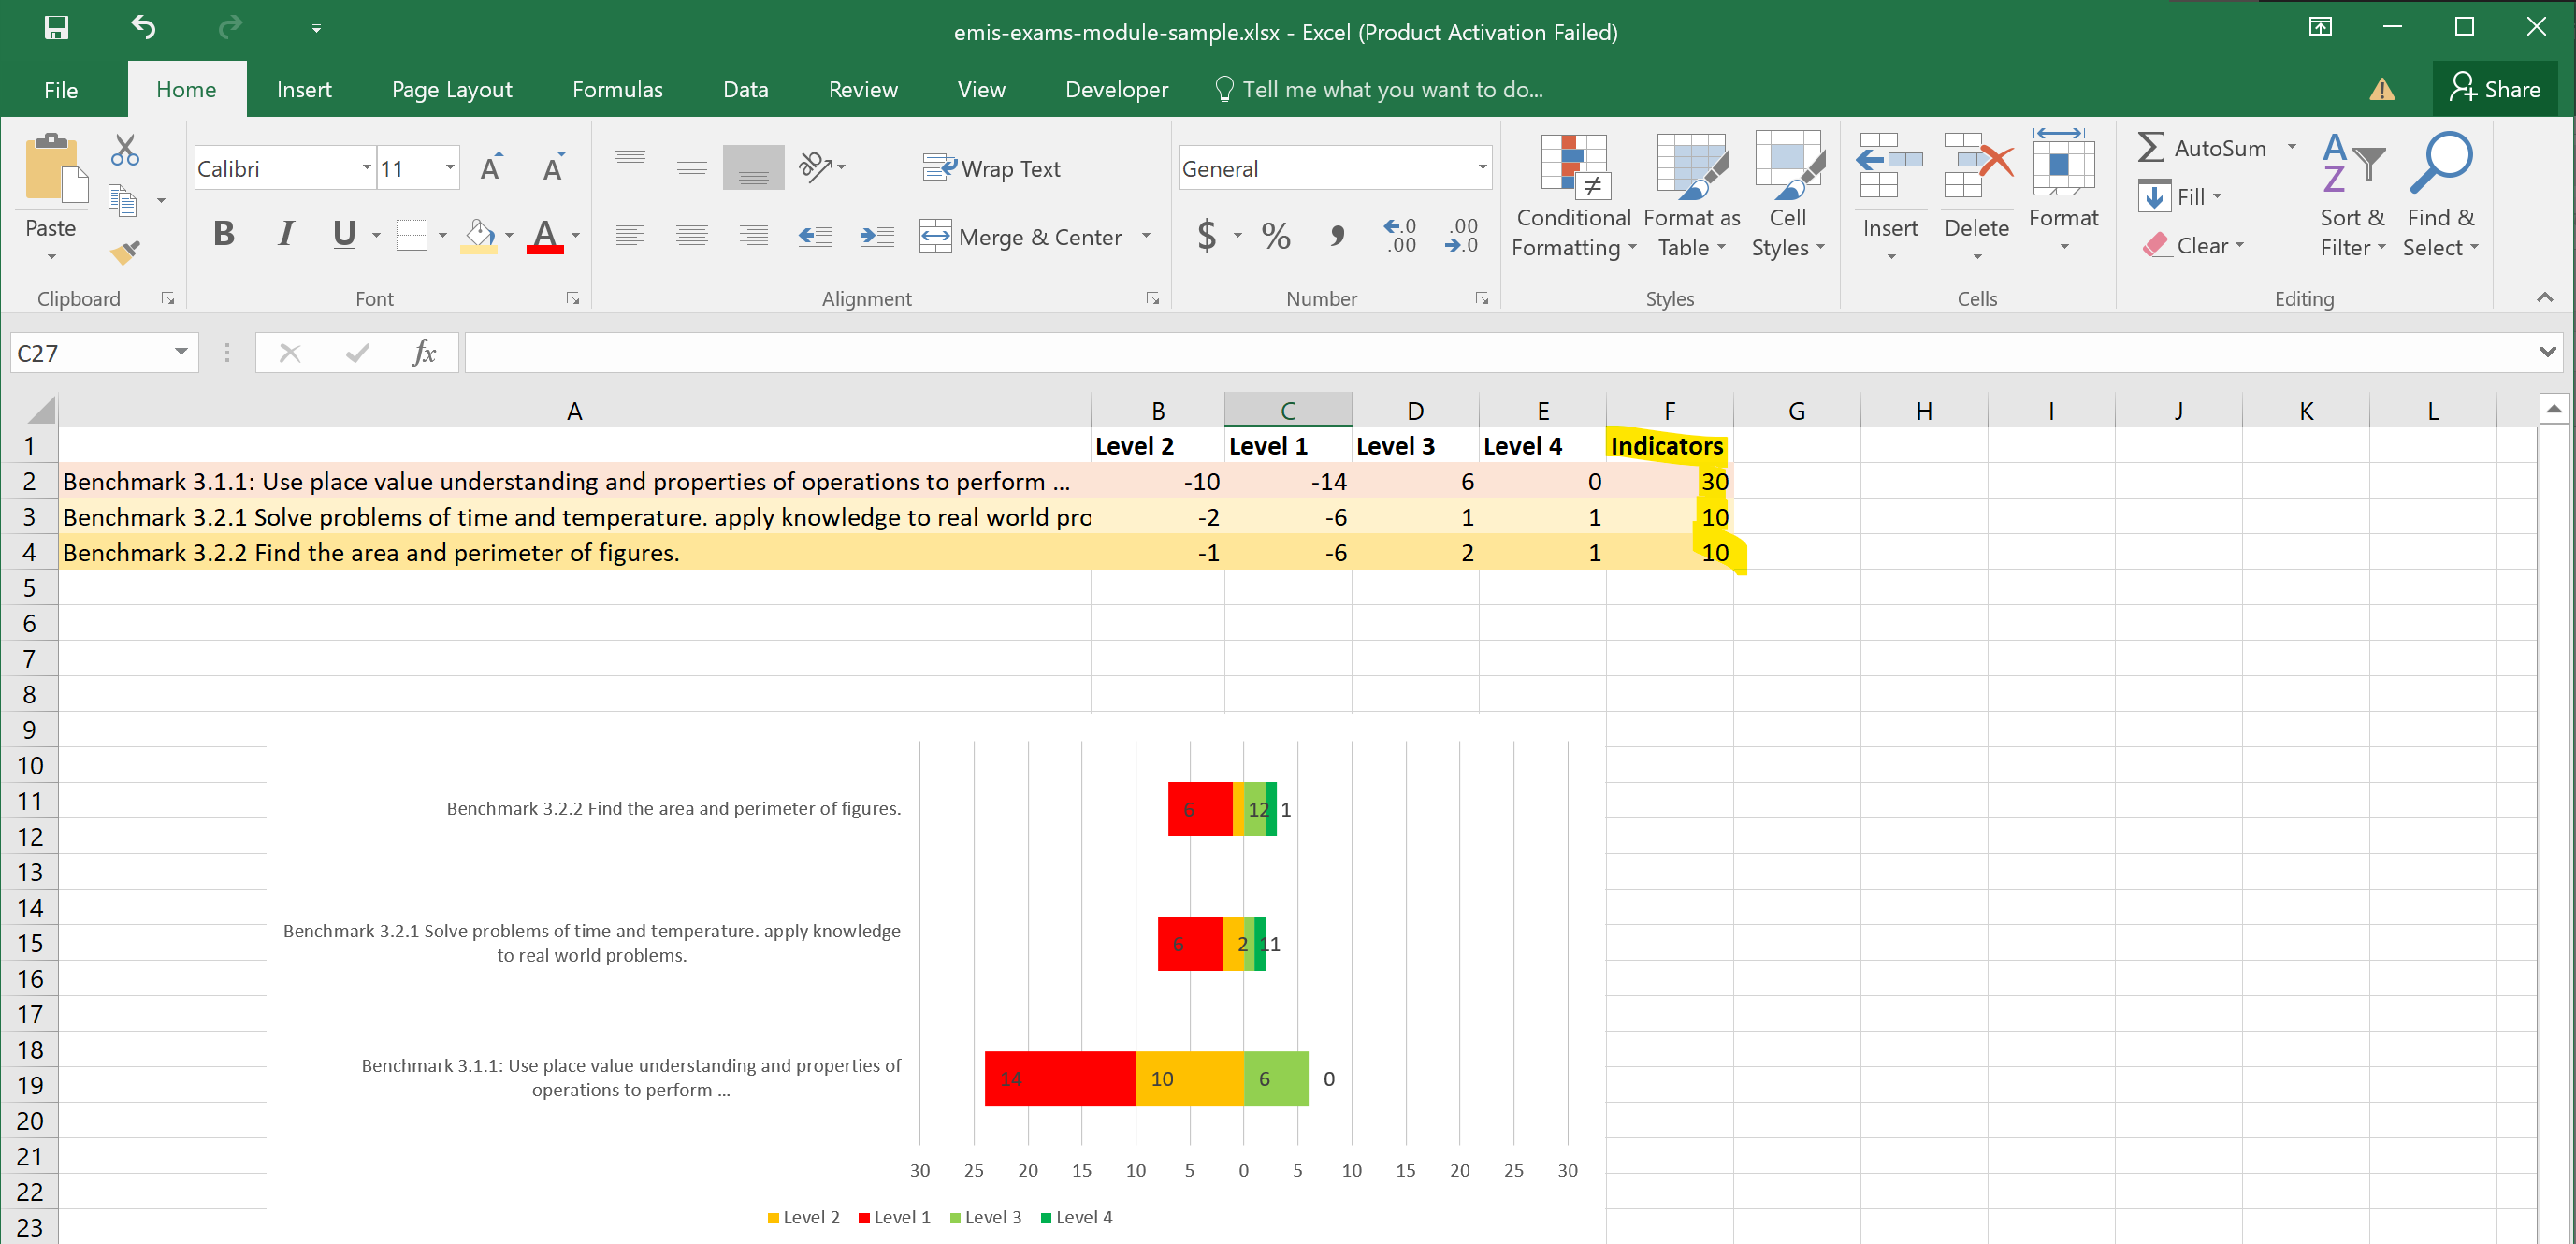
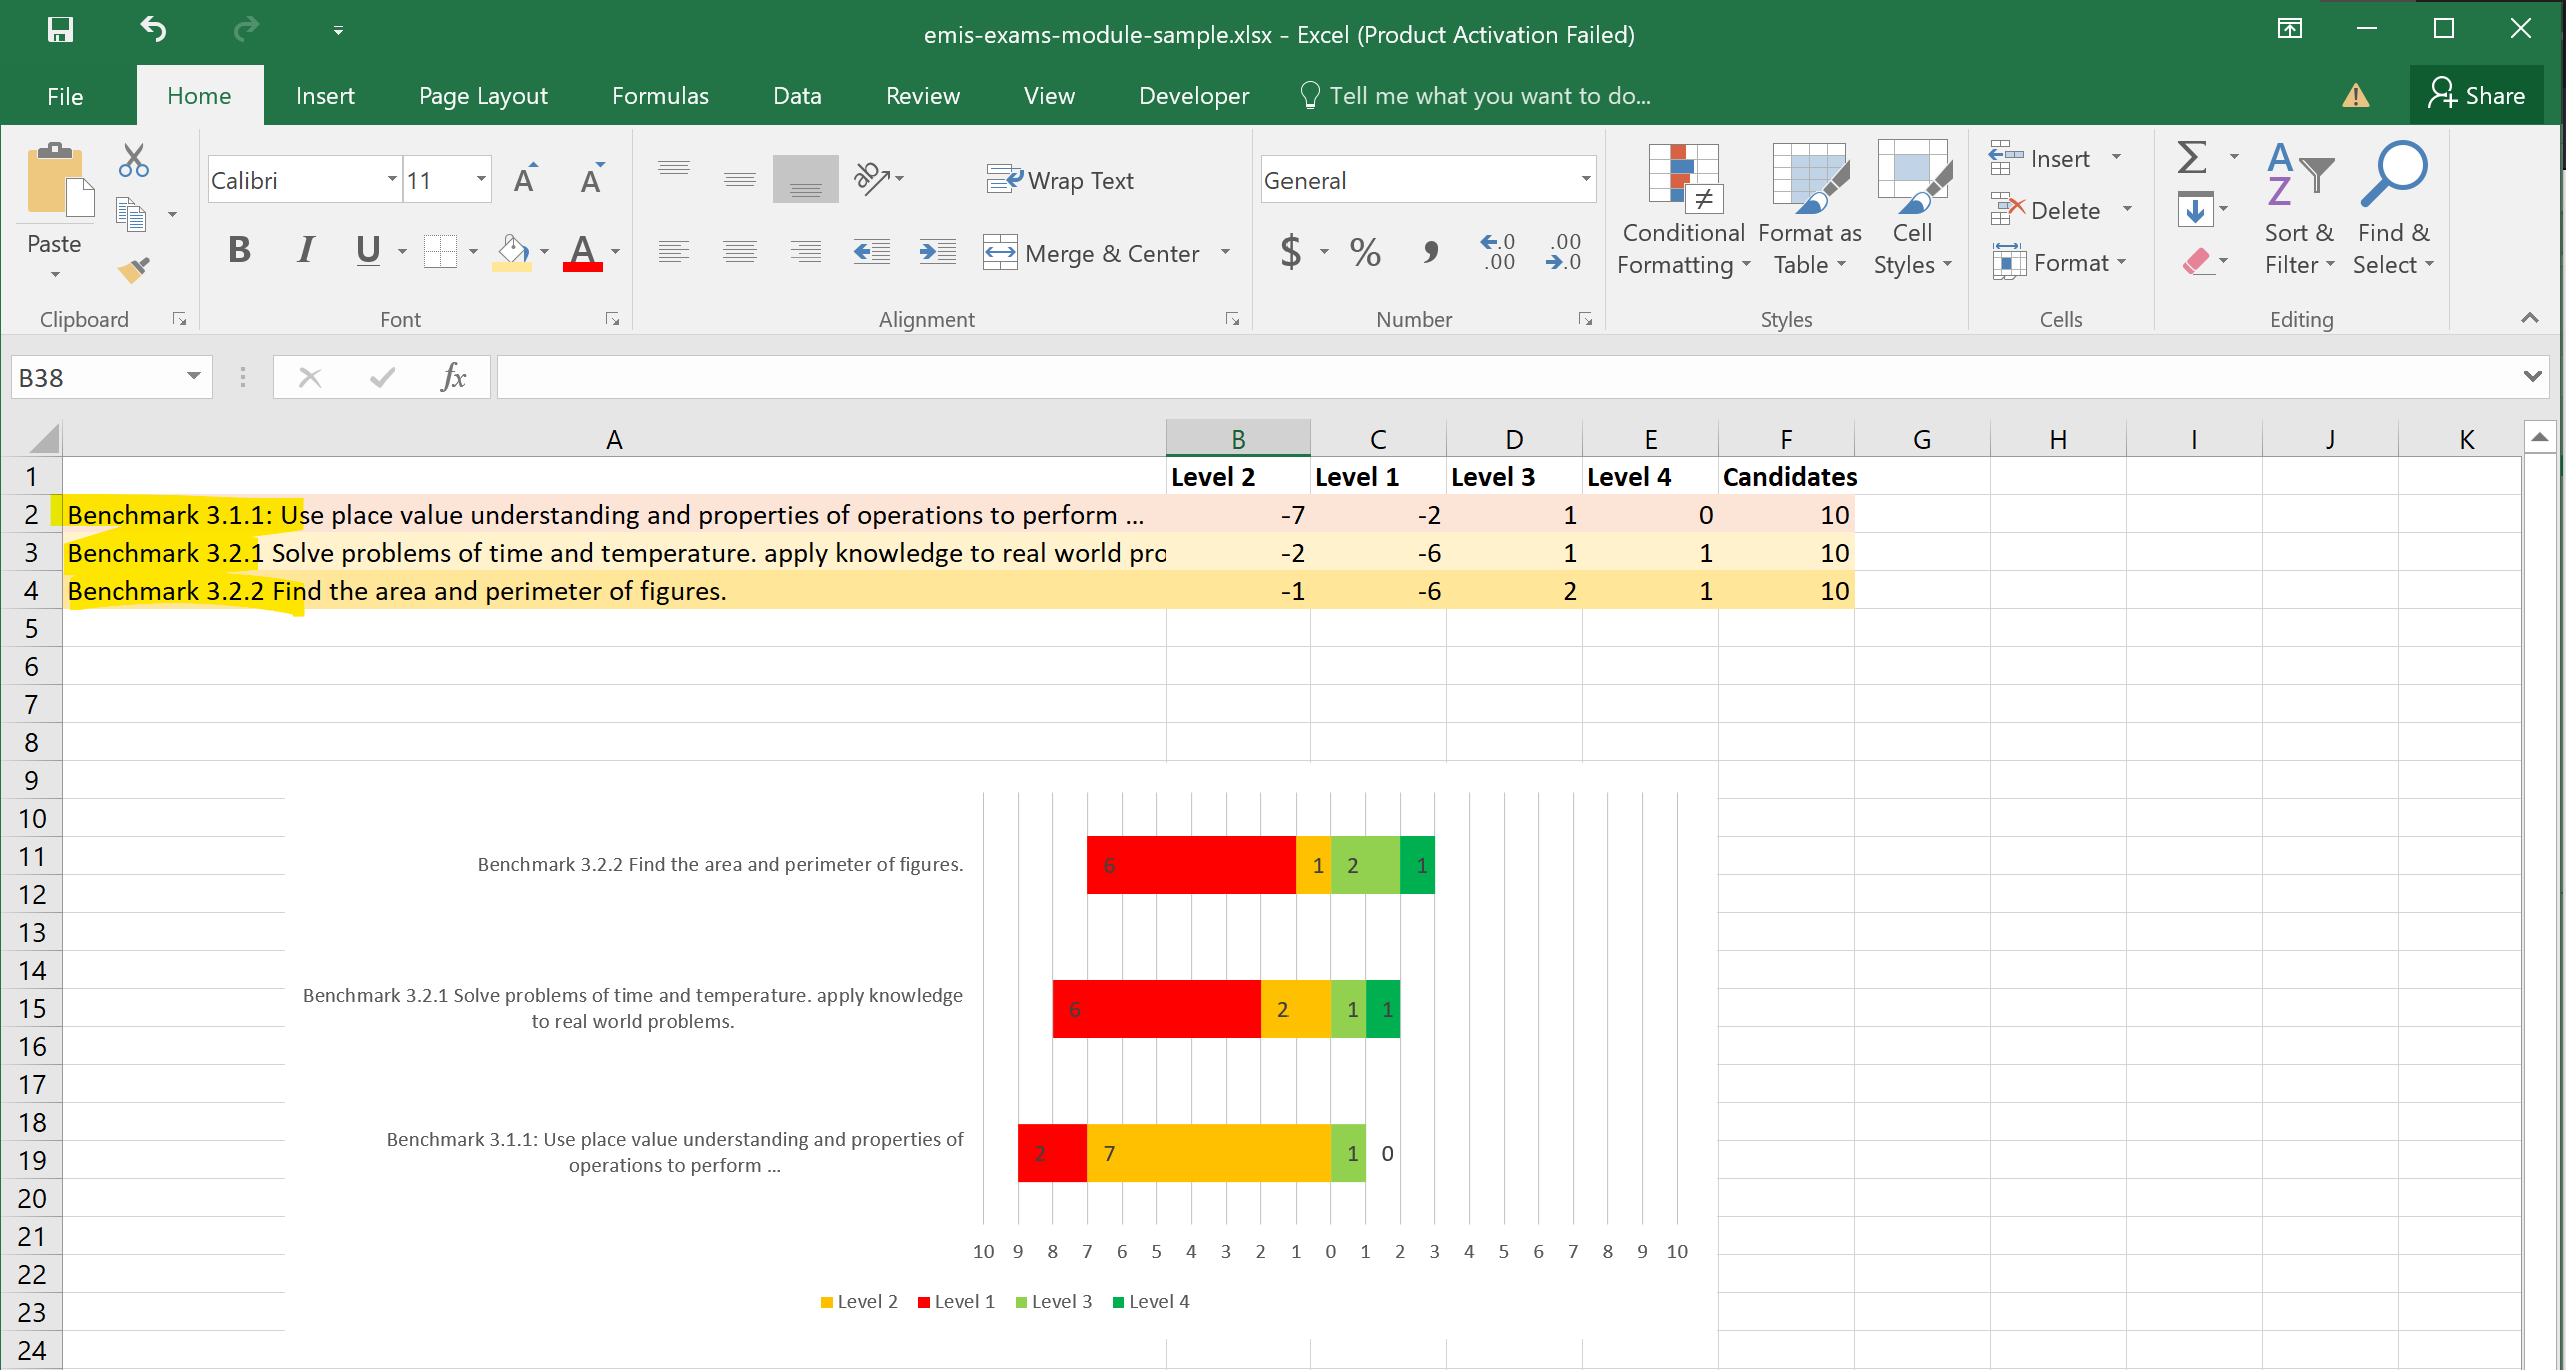
What follows is a illustration of how this analysis would be produced. The items for the three different benchmarks are highlighted in their own respective colors.
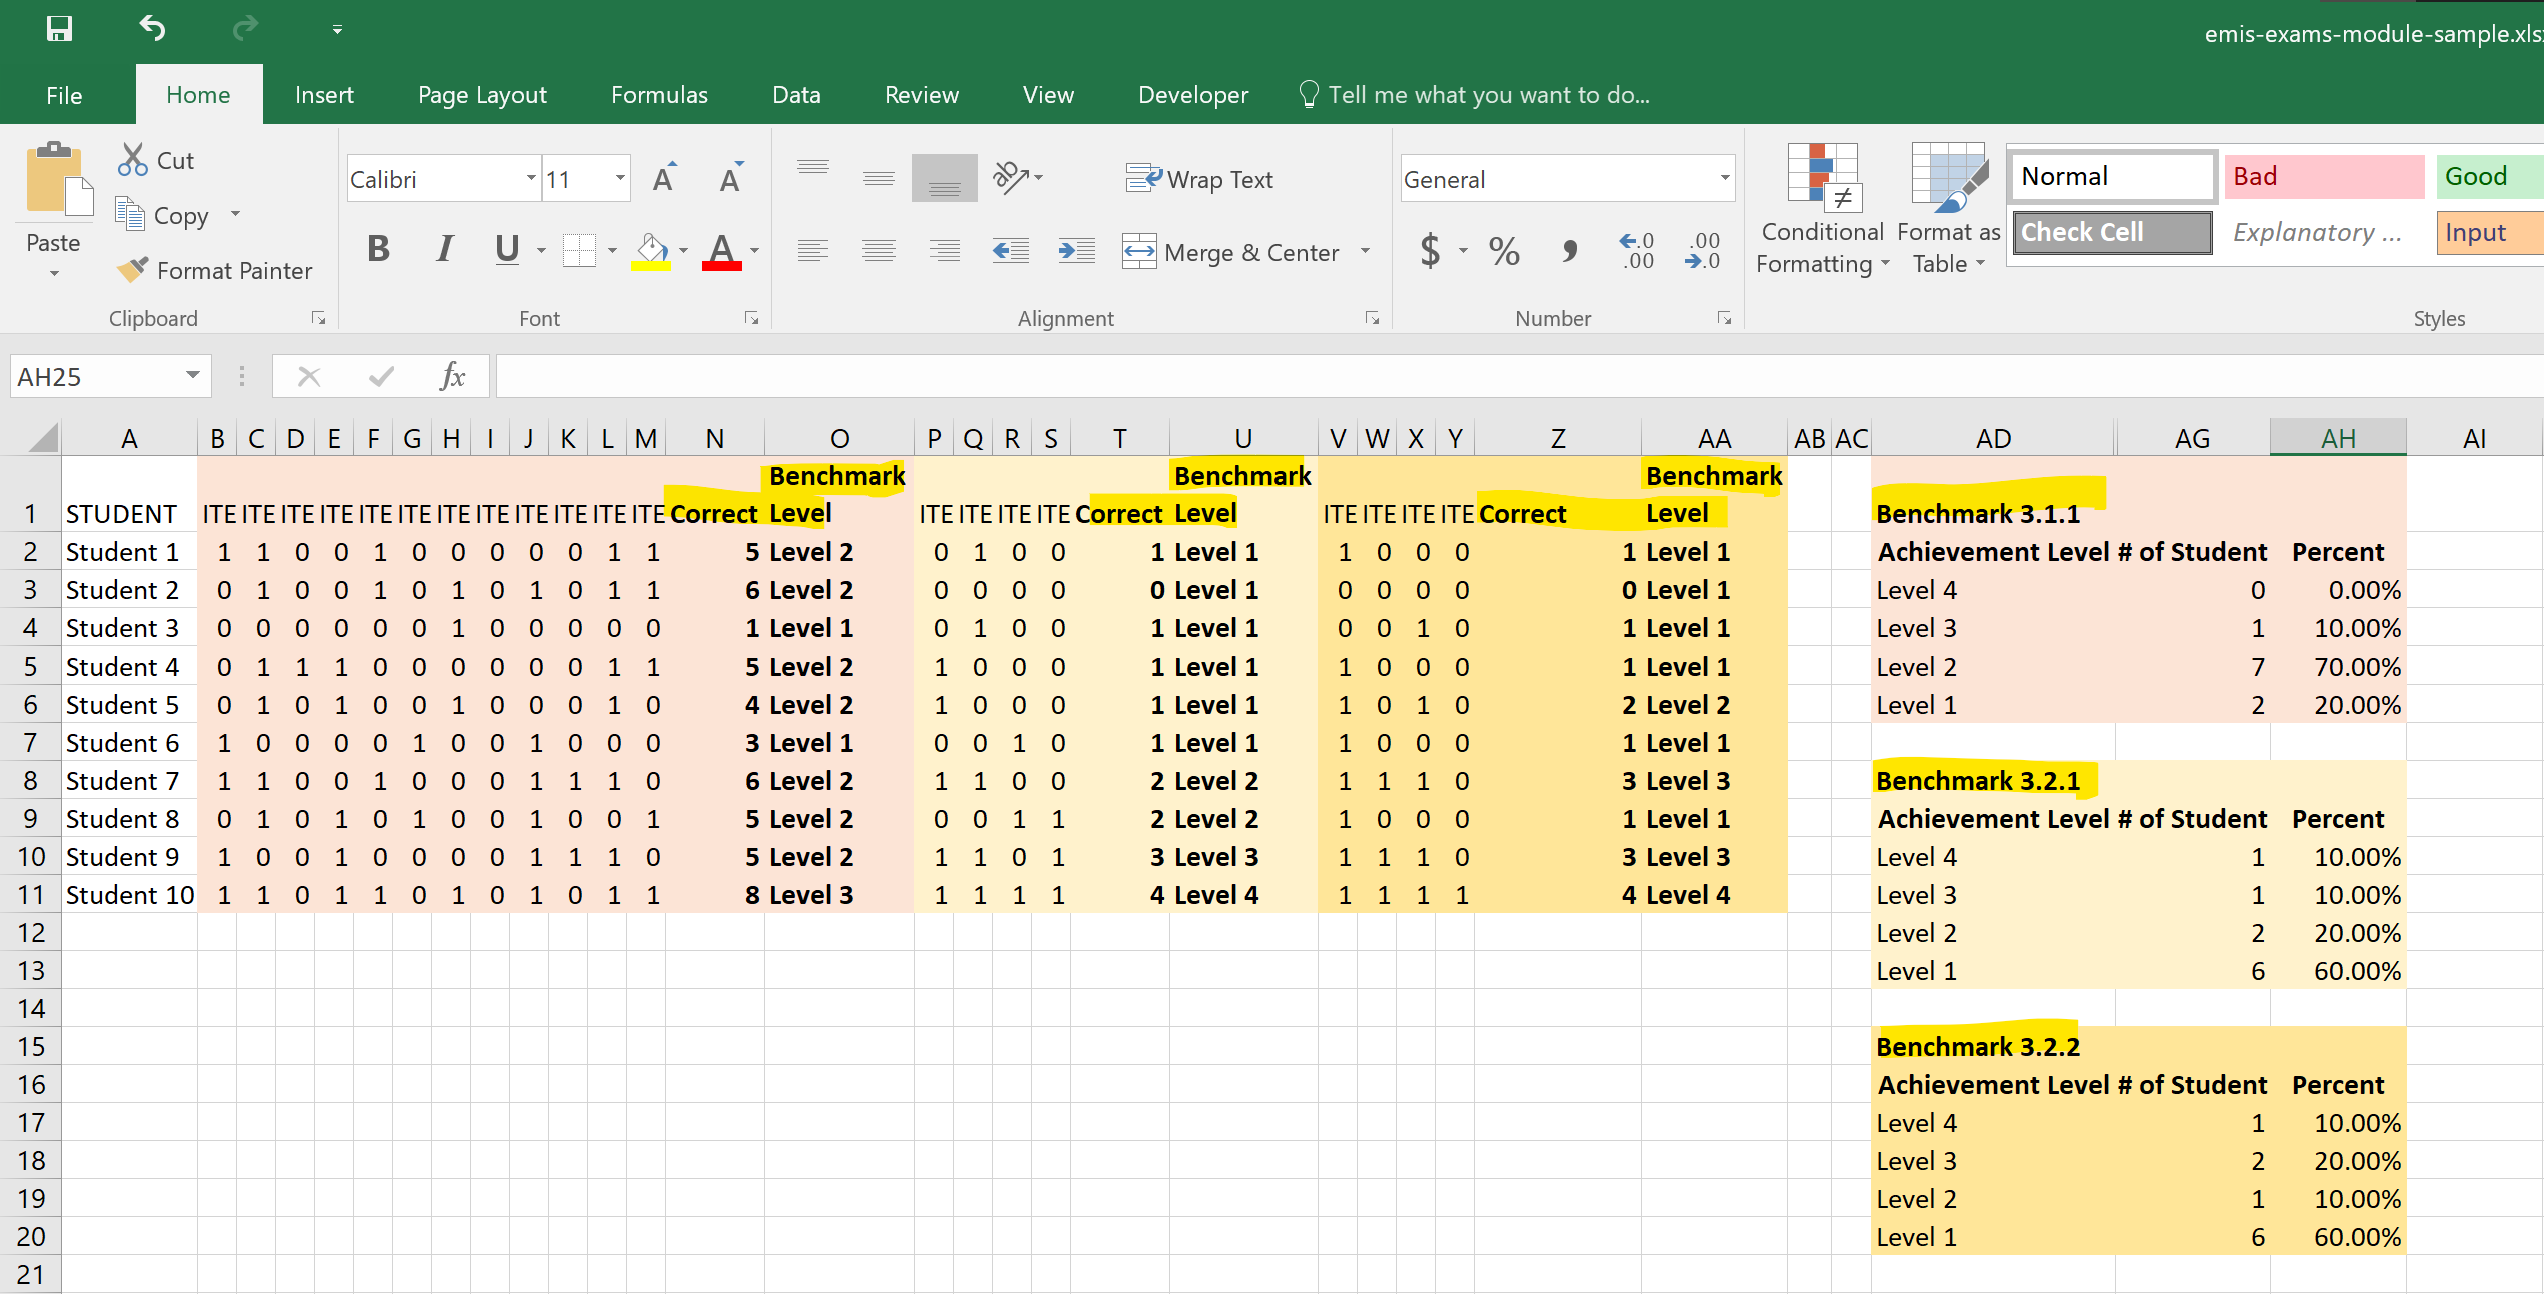
And the resulting chart.
By indicators
From our original example we have 5 indicators. And we know that each indicators have 4 items each on the exams.
- Indicator 3.1.1.1: Use base-ten blocks to count, read and write numbers to …[4 ITEMS] with the cut-offs as:
- 0 to 1 items correct out of 4 ⇒ Level 1
- 2 items correct out of 4 ⇒ Level 2
- 3 items correct out of 4 ⇒ Level 3
- 4 items correct out of 4 ⇒ Level 4
- Indicator 3.1.1.2: Understand and use properties of multiplication (e.g. commutative property …[4 ITEMS] with same cut-offs as above
- Indicator 3.1.1.3: Divide with tables of 6, 7, 8, and 9 using models …[4 ITEMS] with same cut-offs as above
- Indicator 3.2.1.1: Tell time to the minute. Read time on a digital clock…[4 ITEMS] with same cut-offs as above
- Indicator 3.2.2.1: Understand the meaning of area. Use square units to find[4 ITEMS] with same cut-offs as above
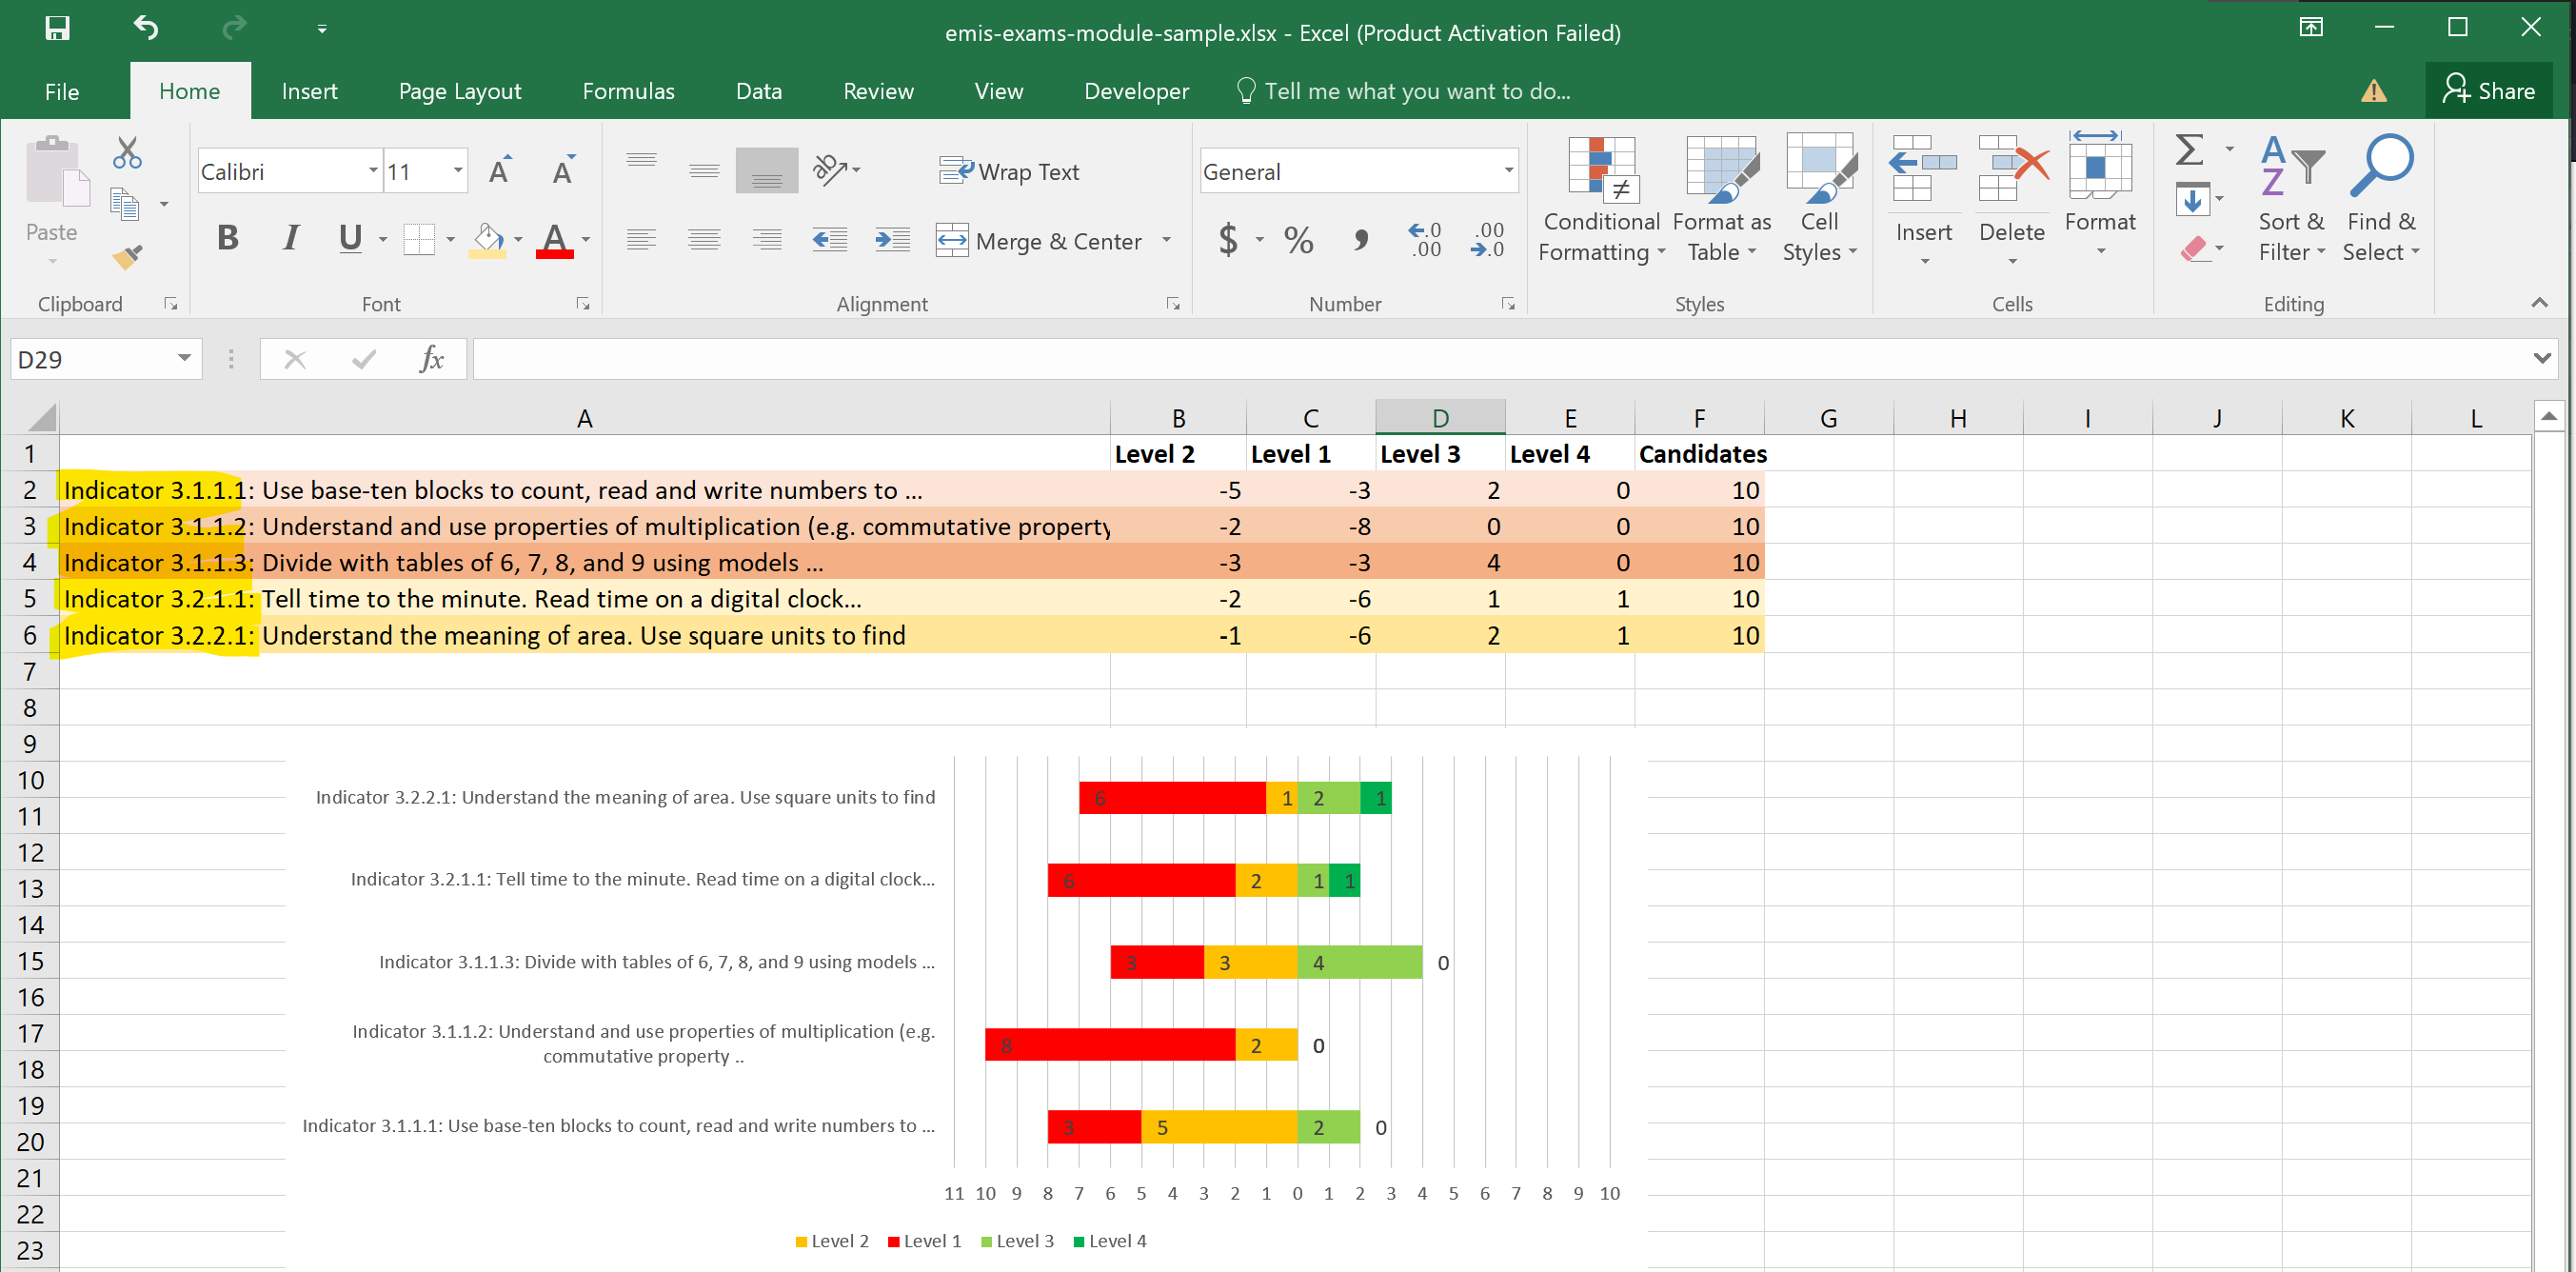
What follows is an illustration of how this analysis would be produced. The items for the five different indicators are highlighted in their own respective colors.
And the resulting chart.
Analysis Method - Indicator Count
Candidate count is the simpler more natural way to analyze the results. However, it is not the only way. The indicator count traditionally used in SOE Assessment does it differently. Instead of counting students performing at each levels of achievement for benchmarks, standards and whole exams this methods count the indicators performing at the levels of achievement for benchmarks, standards and whole exams.
How exactly does this work? First, the analysis on indicators must be done and it is done just like in the candidate count method shown above. That is the starting point and everything else is based on the indicators results.
By exam (whole test)
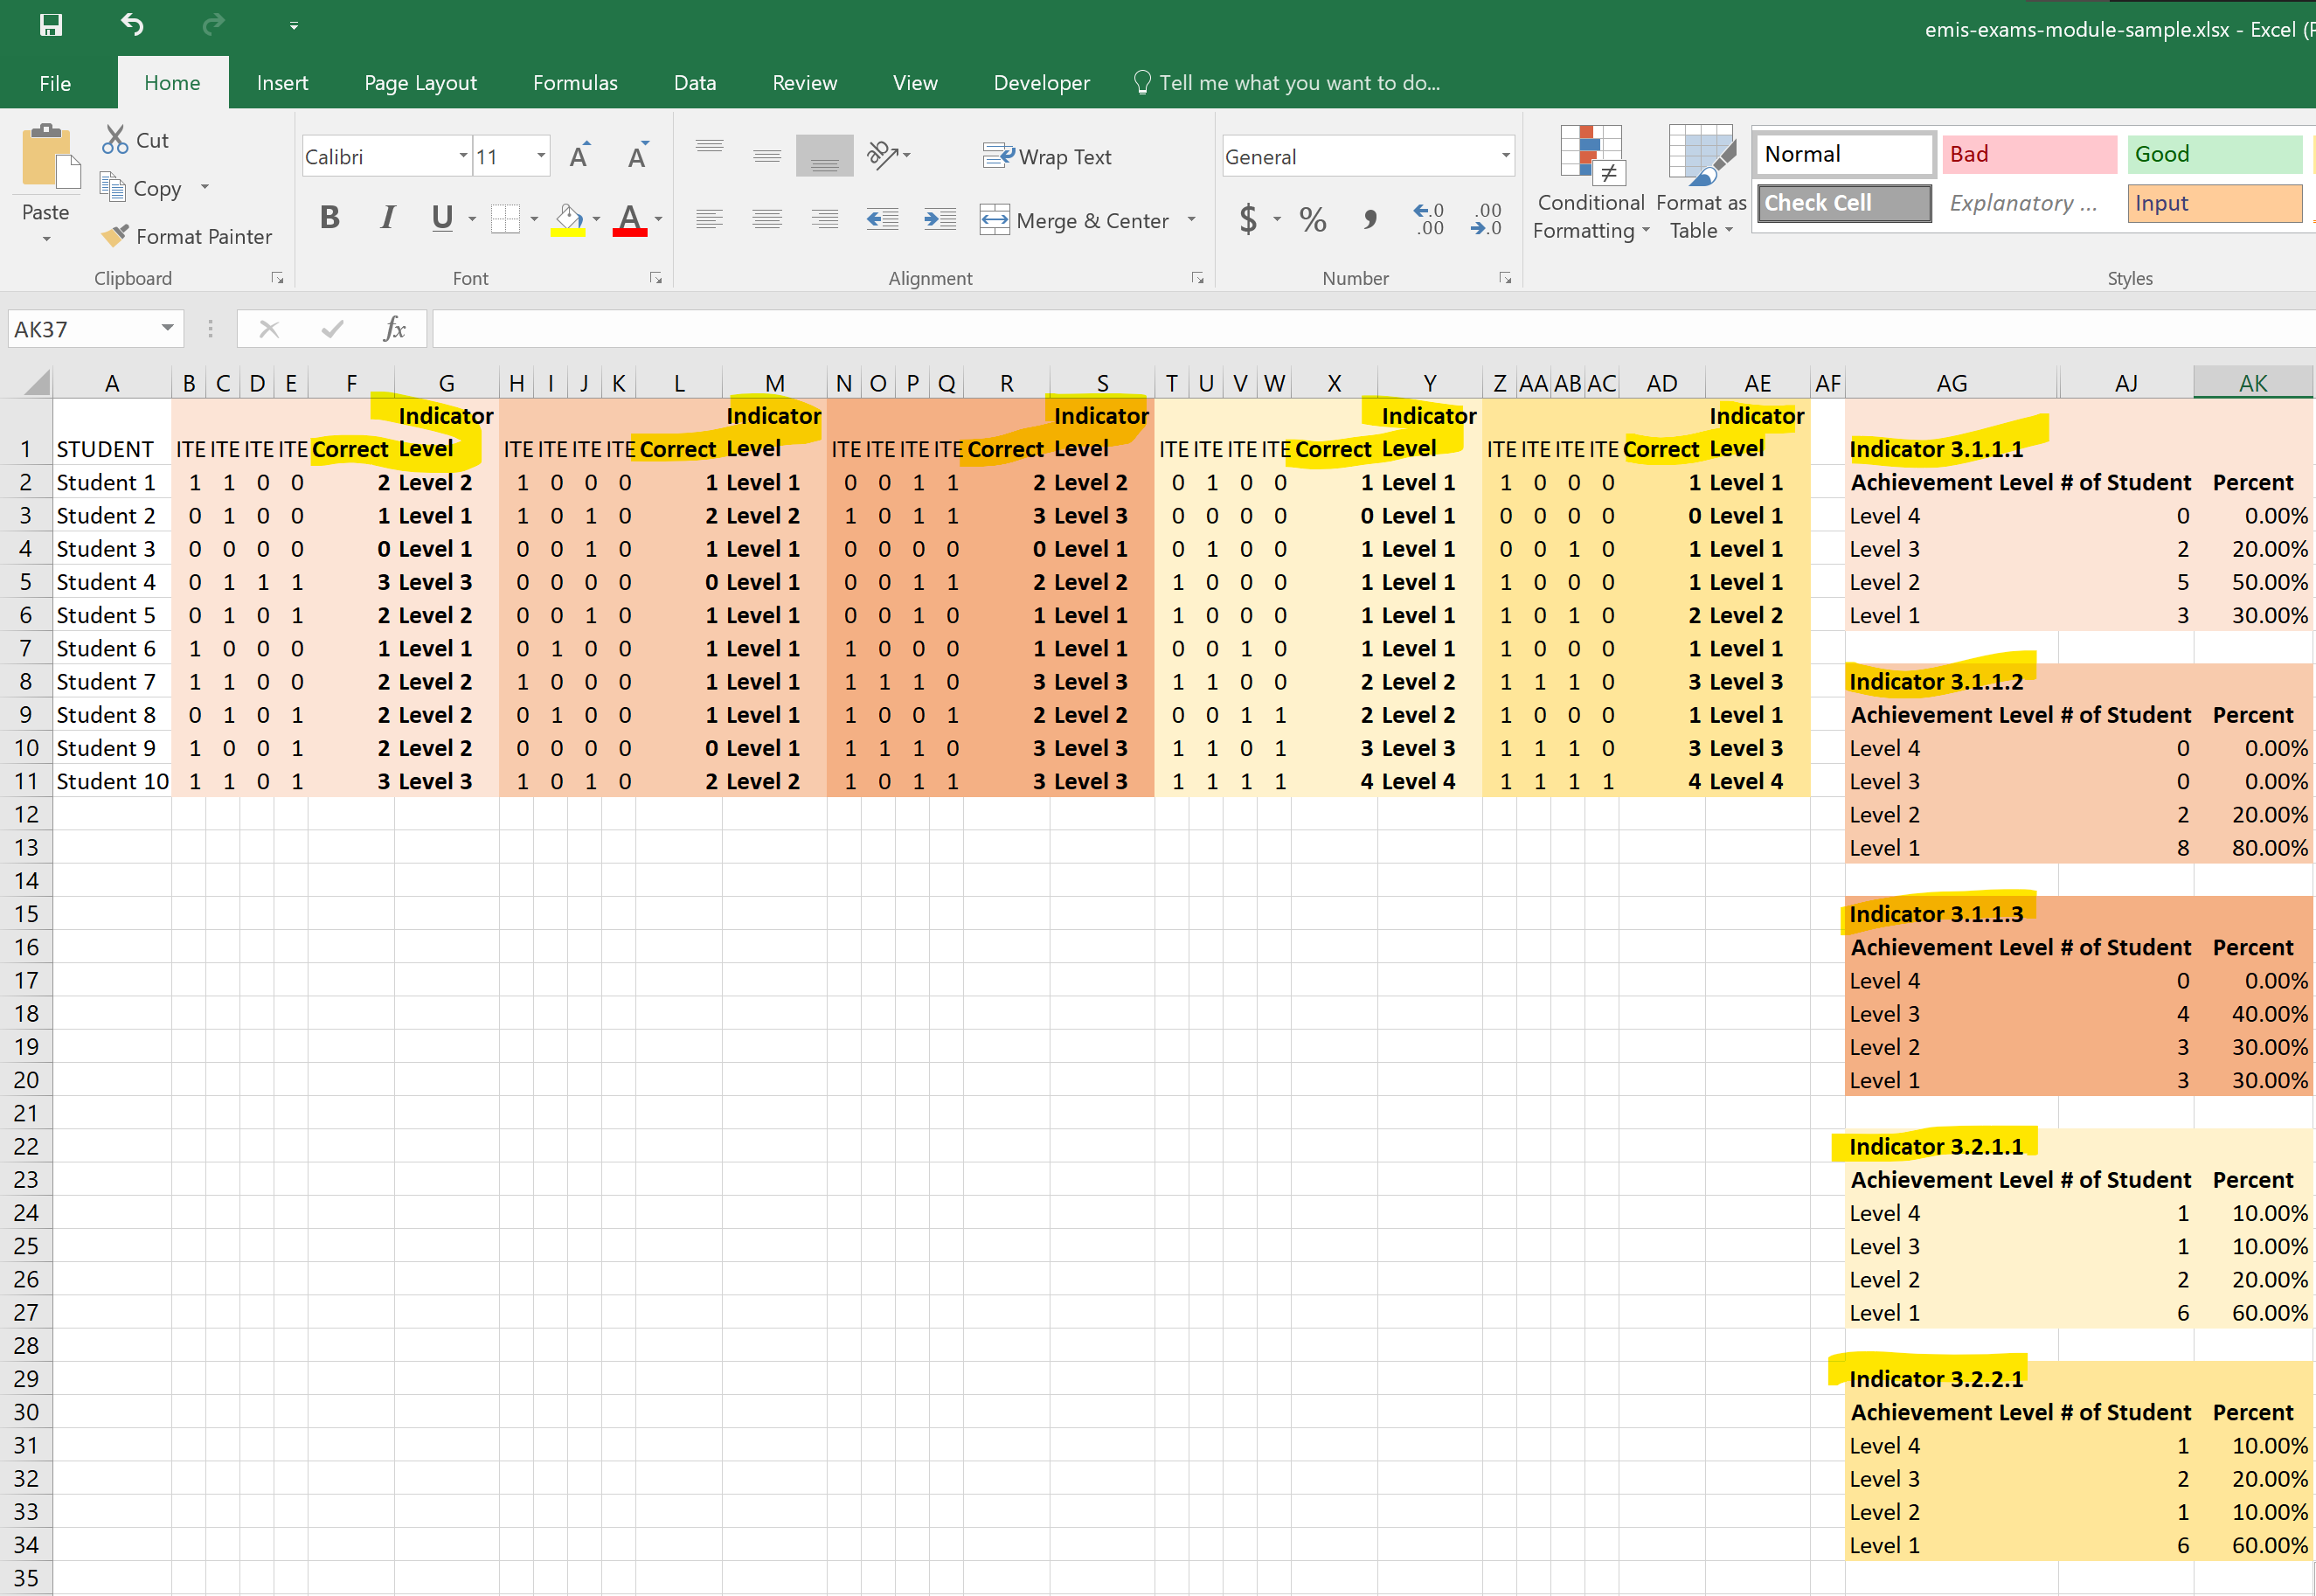
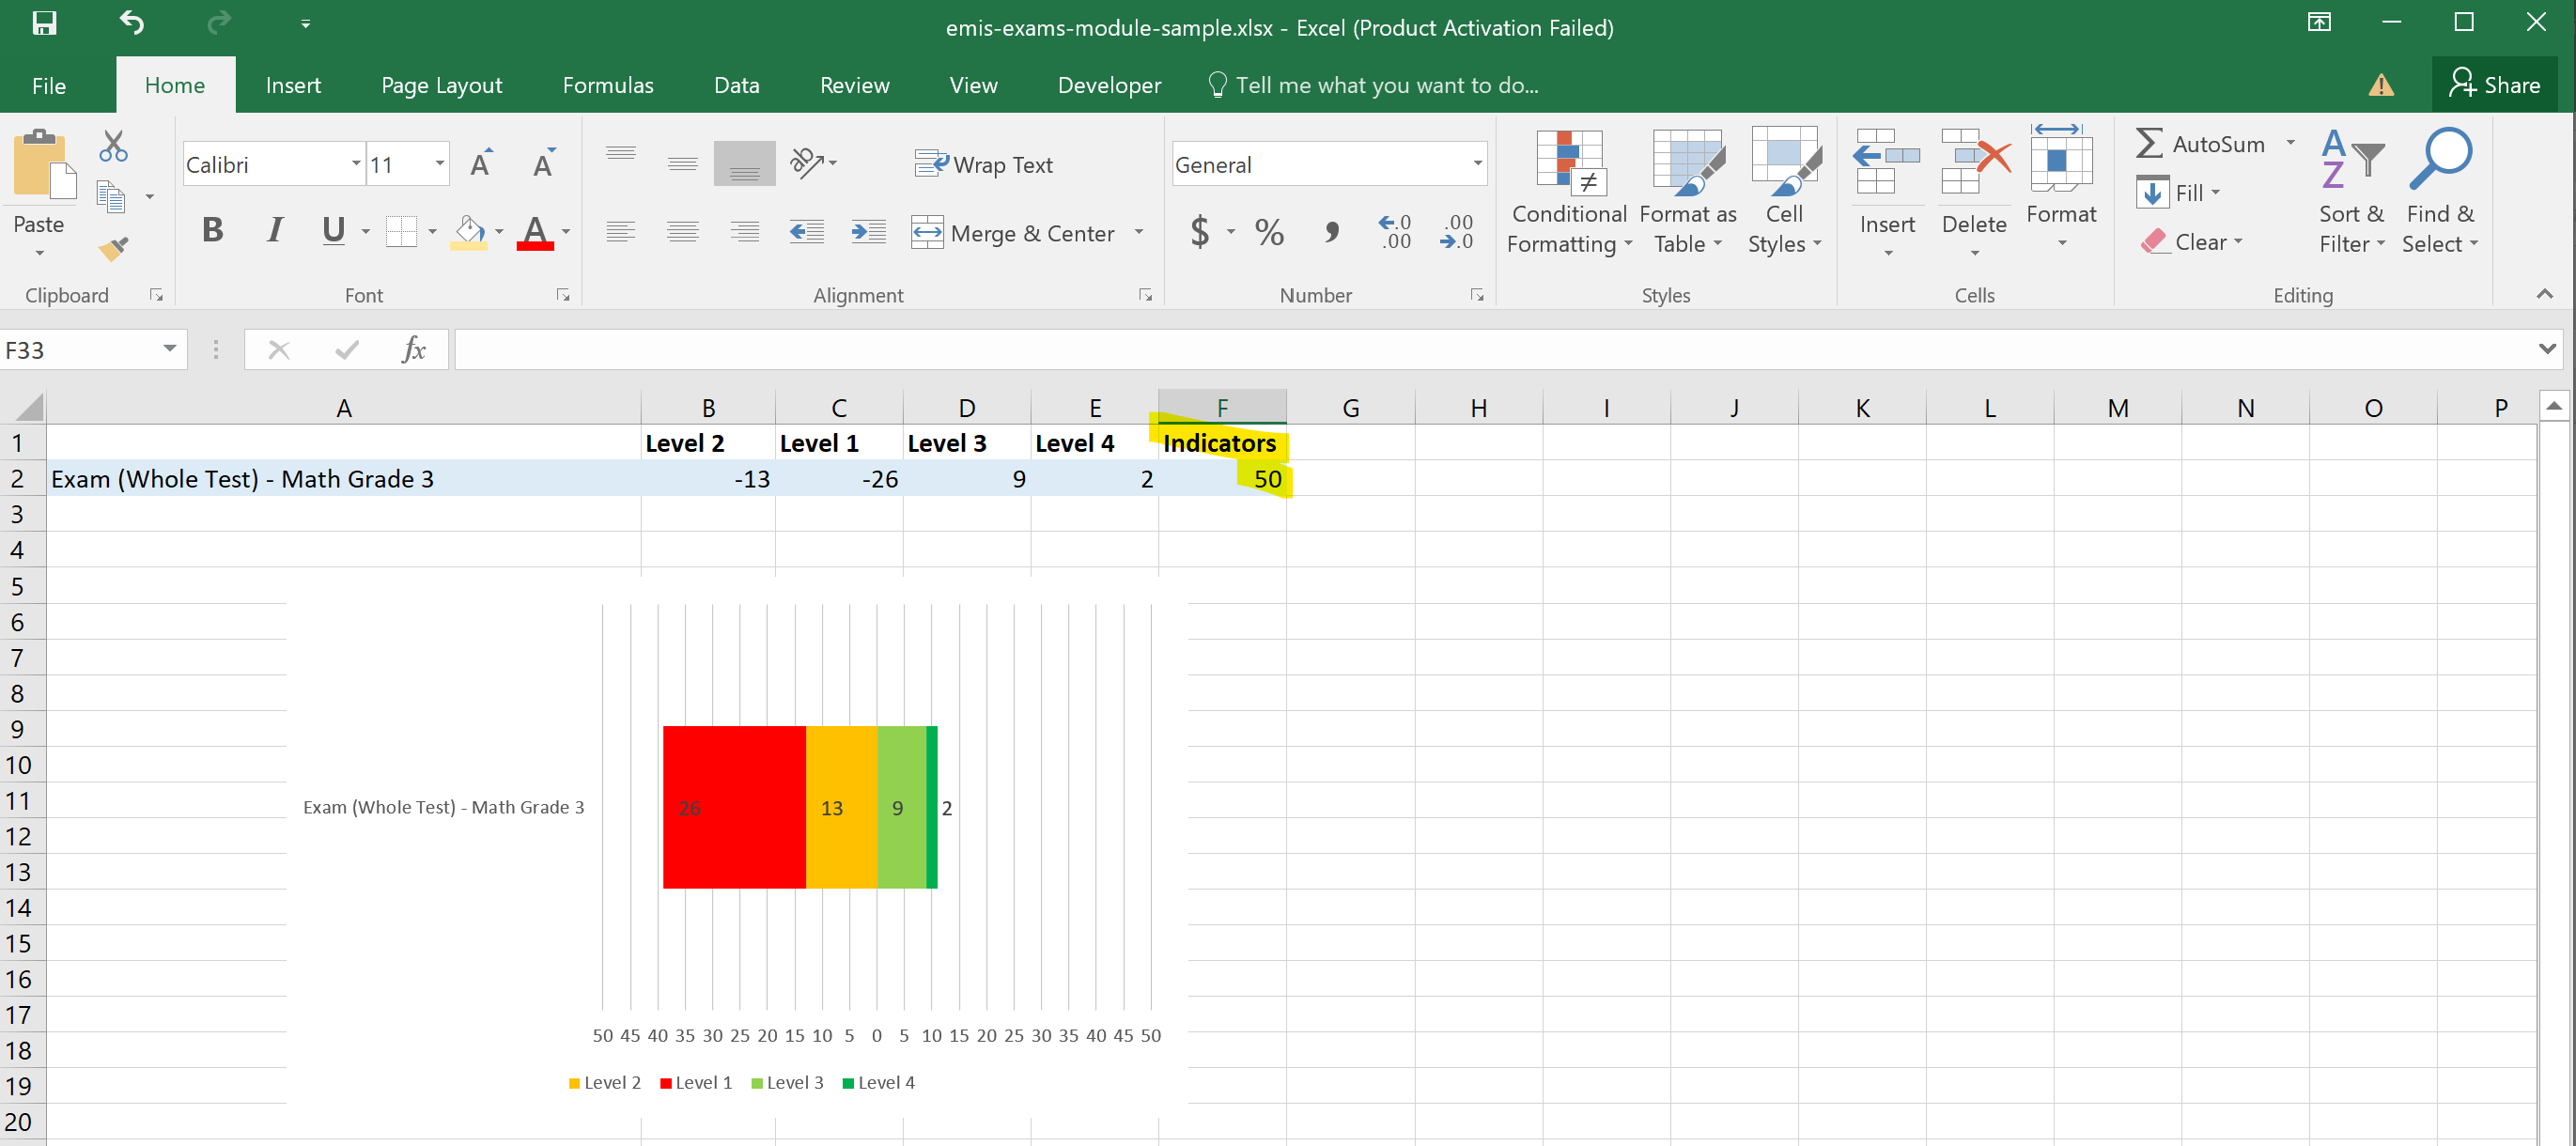
Since every single indicator is part of the exam. For the analysis of the whole we count all the Level 1, Level 2, Level 3 and Level 4 for all indicators. Totalling them up should equal the number of student (i.e. i our example 10) multiplied by the number of indicators (i.e. in our example 5), therefore 50.
This then translates into the following analysis.
By standards
For standards, we need to group the indicators into their respective standards as shown in the following figure. And we do a count on those.
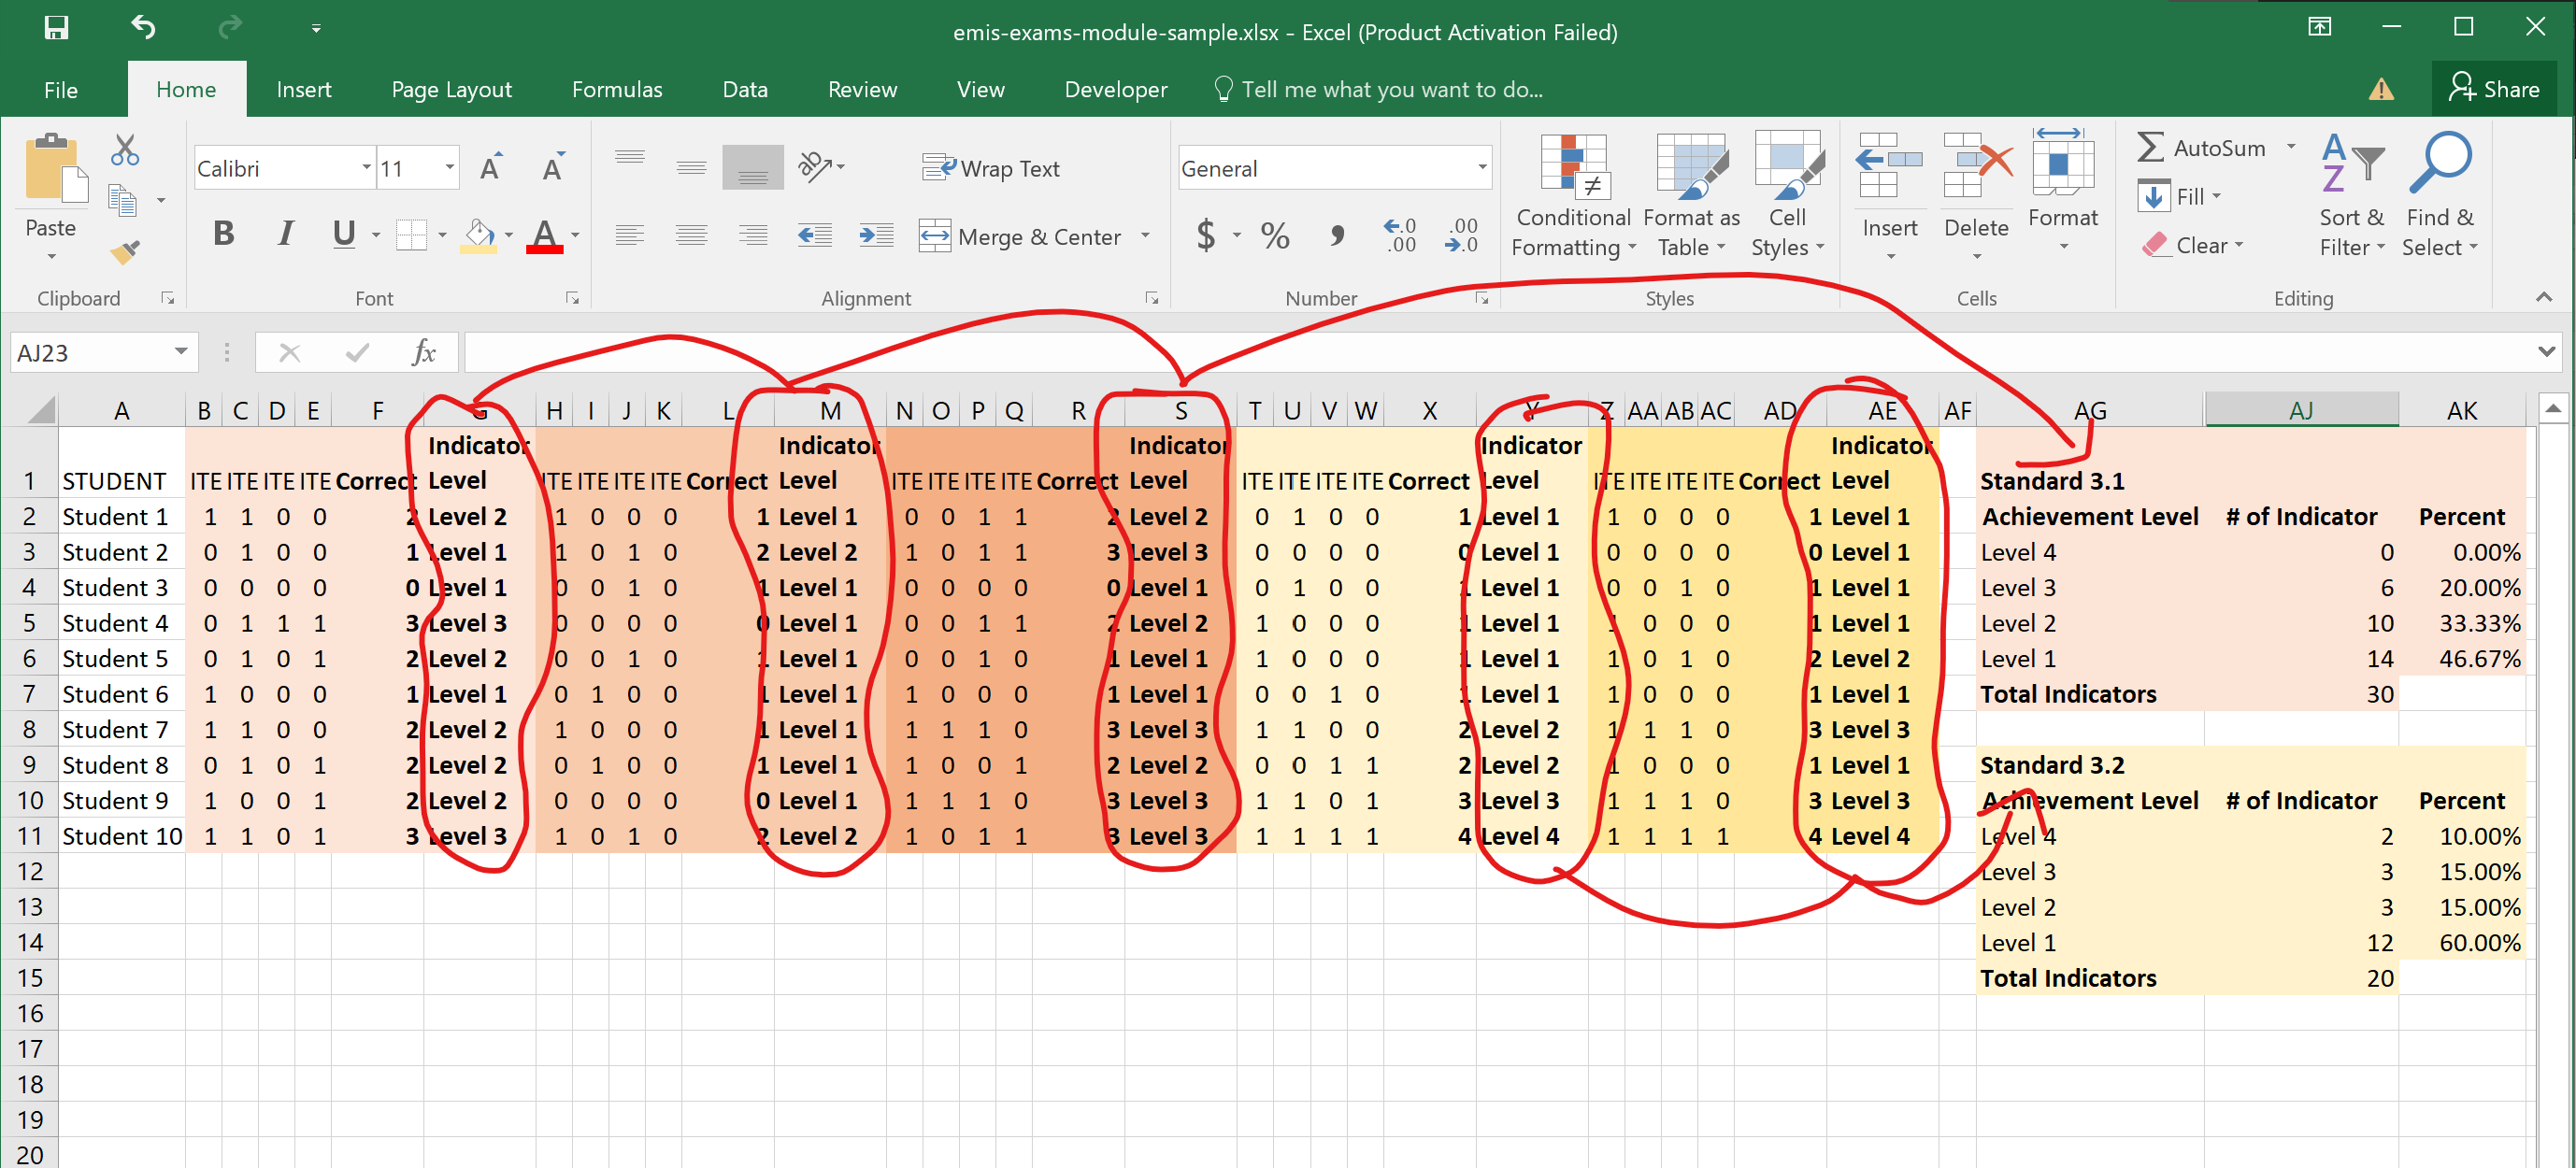
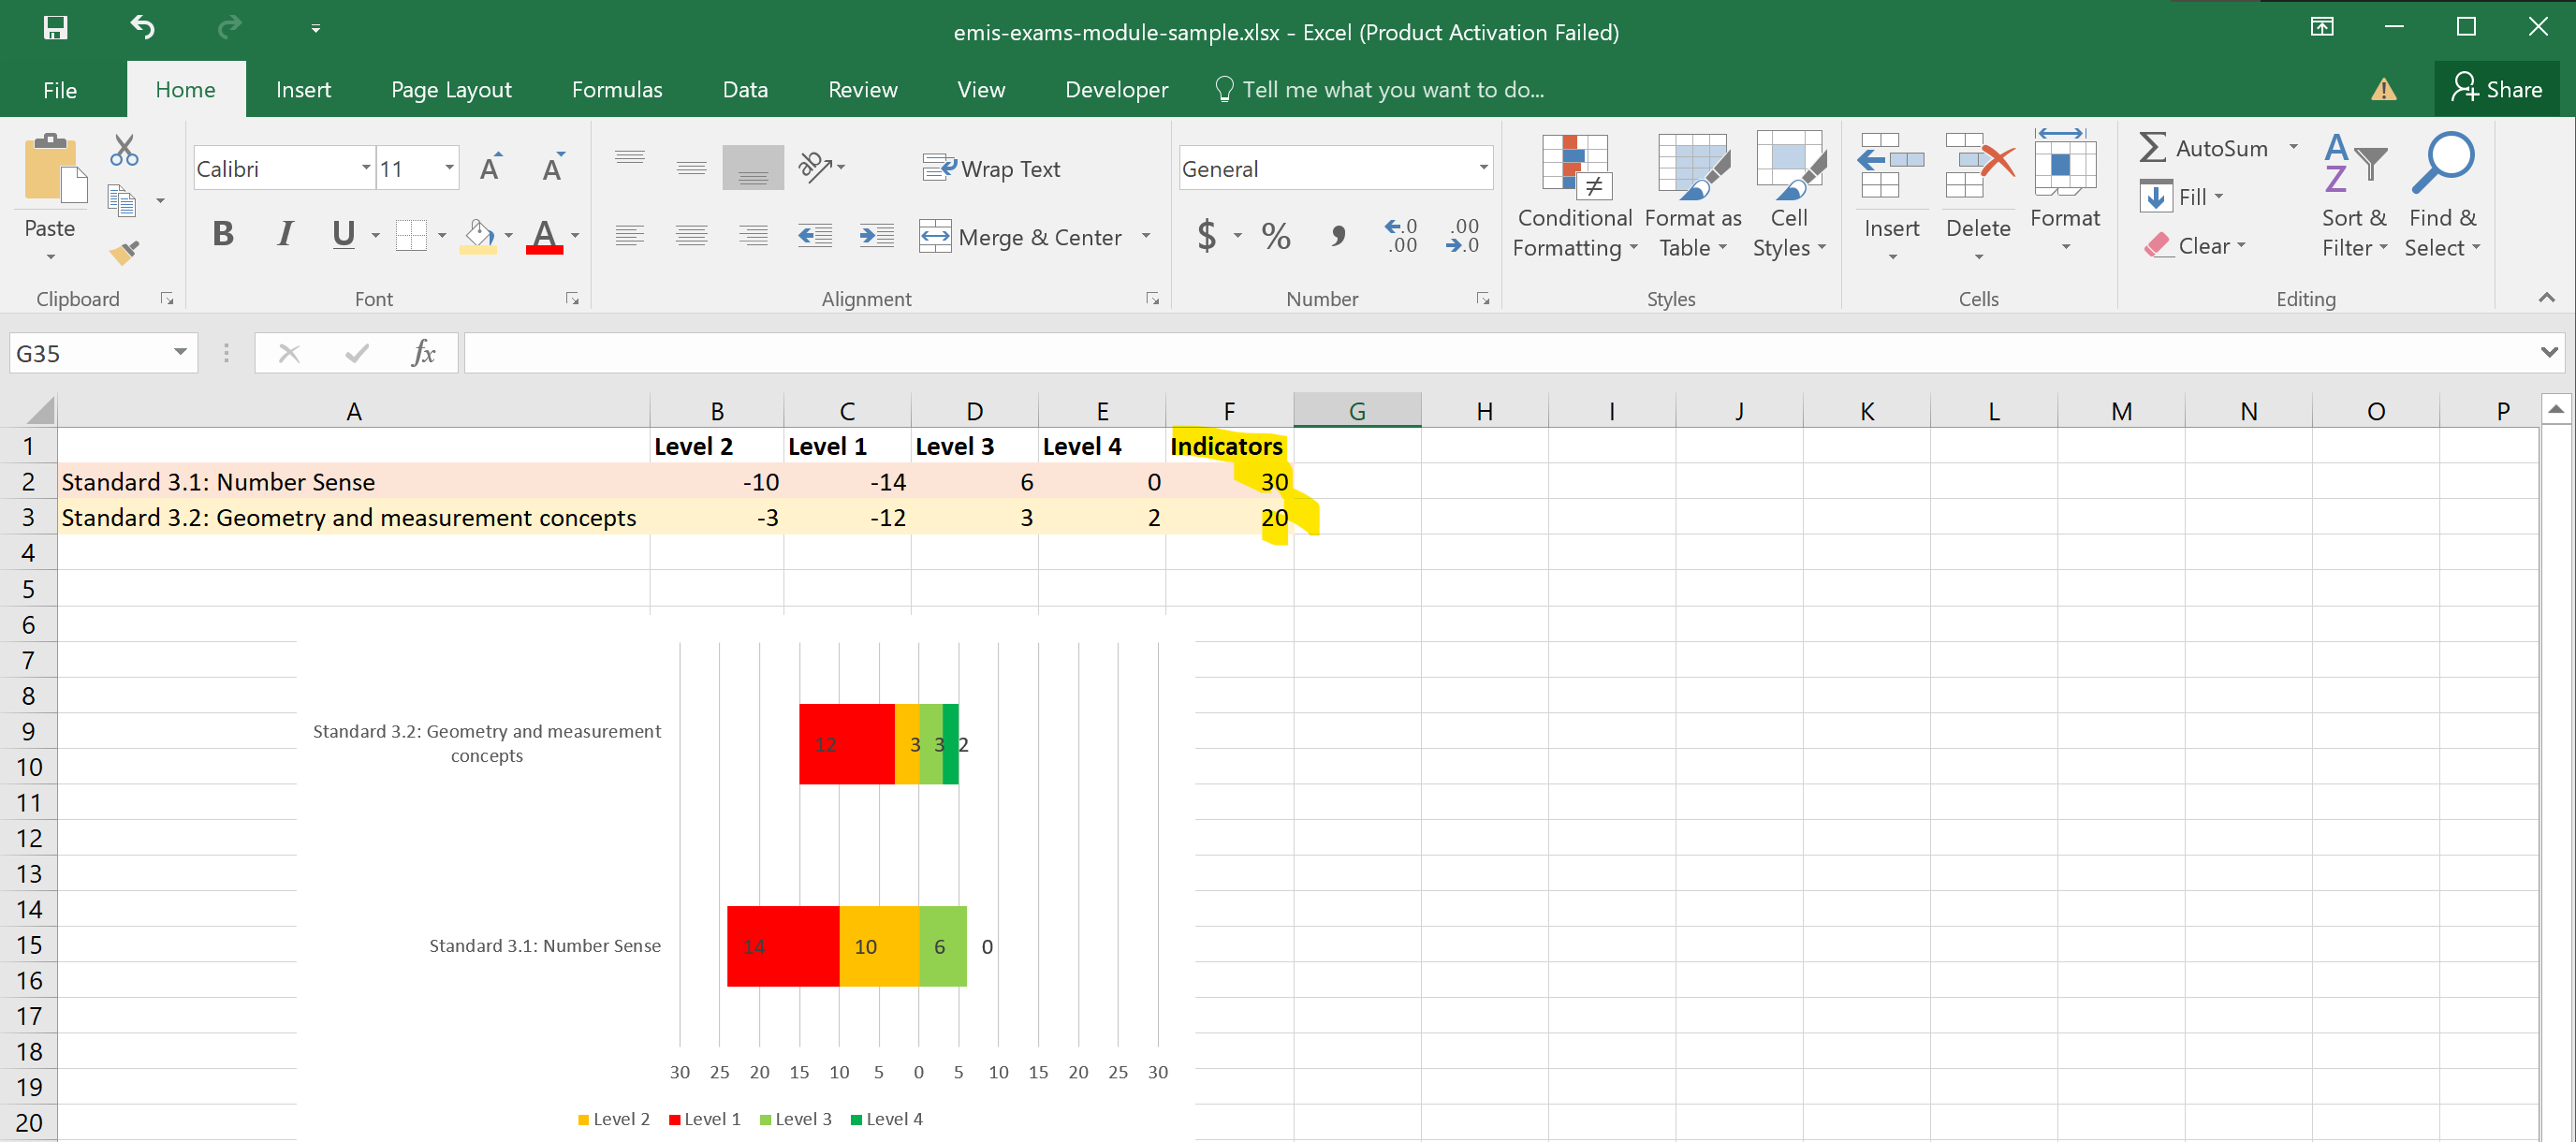
This will then translate into the following.
By benchmarks
Similarly to standards, for benchmarks we also group the indicators into their respective benchmarks and count from there.
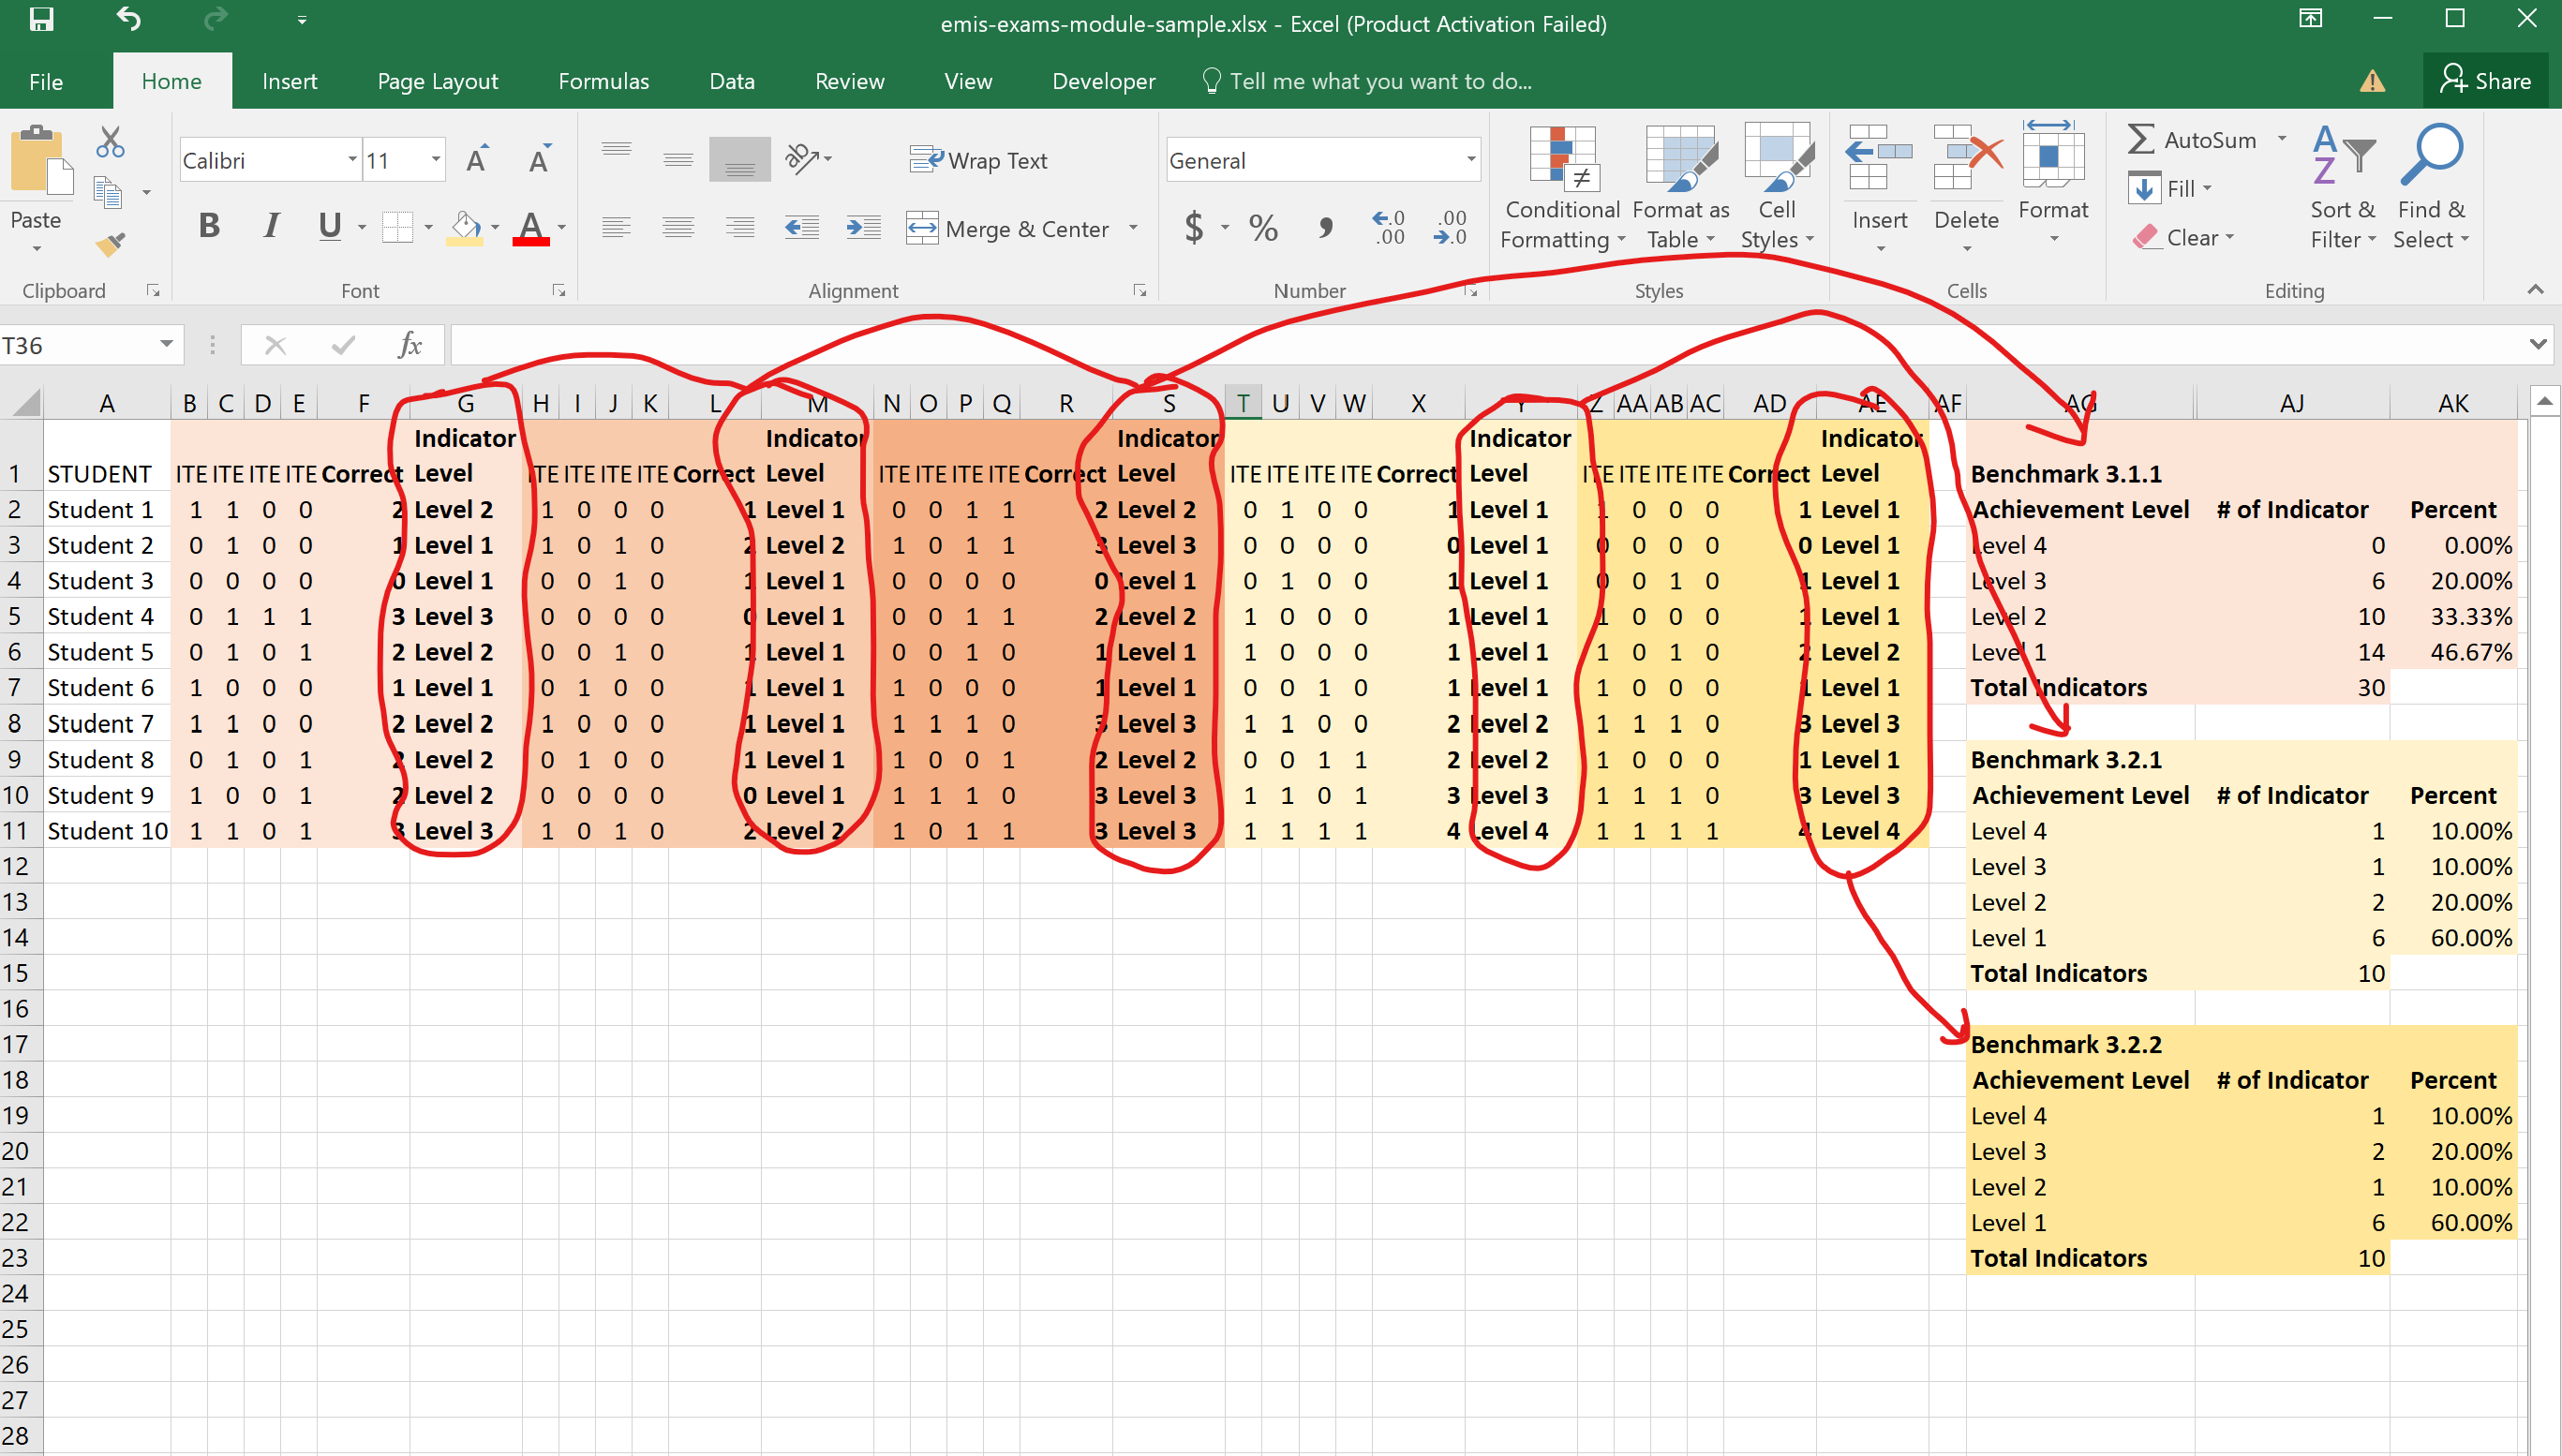
Resulting in the following analysis.