
Table of Contents
Pacific EMIS Developer Guide
Introduction
This guide is for any developers contributing to this project in one way or another. This guide documents high level development architectural design, development environment, development workflow, policies and procedures without going into lower level details of the source code and APIs which is documented currently directly within the source code itself.
Project Overview
The Pacific EMIS is a single page web application built with AngularJS and ASP.NET technologies. While built on a modern technology stack it has roots from a battle tested Microsoft Access desktop database application that was first started in 2002. This developer guide is mostly geared towards the Web application only.
Project Structure
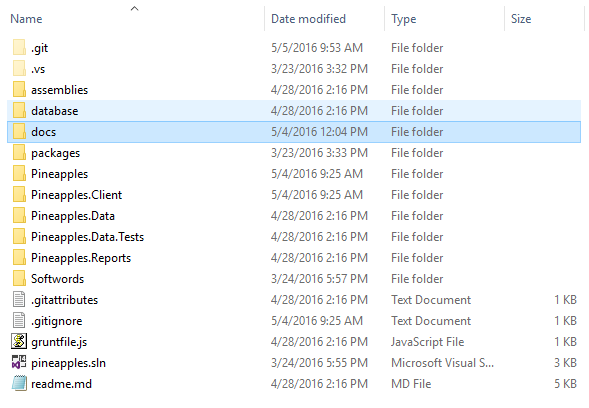
The Pineapples solution (in Visual Studio parlance) is managed in a single git repository. The solution is organised into 3 main projects (which also translates into three folders in the root of the repository):
- Pineapples ASP.NET project: This is the startup executable. It is responsible for delivering all objects to the browser, including the initial page, all required scripts, stylesheets, and other assets. Pineapples implements both WEB API 2 and MVC interfaces. The Web API 2 interface delivers data in JSON format to the client on request. The MVC interface delivers html to the client including the initial page and views inserted into that page.
- Pineapples.Data .NET class library: This project exposes “business objects” to Pineapples, and is responsible for reading and writing data to the SQL server database. This project also includes any required JSON serializers used by Web API 2 to construct and tear down objects received / sent over the REST interface.
- Pineapples.Client .NET Web Site. The client front-end (i.e. javascript and css files executed in the browser). As a web site, this project has no project file, and Visual Studio build is turned off. The project is managed using a “web stack” composed of npm, bower and grunt. Other Projects
Some other projects complete the solution though are not needed (and some not even used):
- Pineapples.Data.Tests: A VS2015 Test project allowing tests of the data layer.
- Pineappples.Reports: This is an SSRS project, home to report definitions and related SSRS objects. These are deployed into the SSRS server. Only a couple of imcomplete samples are included here. JasperReports is instead the reporting platform used.
- Softwords.DataTools: a dependency loaded as a binary in Pineapples.Data
- Softwords.Redirector: a dependency loaded as a binary in Pineapples
- Softwords.Web: a dependency loaded as a binary in Pineapples
Other folders found in the root of the git repository are:
- assemblies: This is home to any additional assemblies that are not part of the project, not part of .NET, and not served by nuget. Placing these in a common location relative to the solution projects makes managing references easier. The assemblies folder sits besides the packages folder created by nuget.
- database: This folder holds a SQLDelta schema file representing the latest schema of the Pineapples database. SQL Delta can compare this snapshot against a database and generate a script to resolve the differences. This was never really used and will be deprecated in favor of new approach
- External Tools: Mostly contains stuff related to the Excel based annual school census
- packages: This is where NuGet installs all the backend dependencies (aka. assemblies and references in VS)
- SqlScript: The SQL schema evolution will now be committed here in the form of plain old SQL scripts and managed by Git.
External Tools
A number of external tools can optionally be used with the main Pacific EMIS database-driven web application.
- PDF eSurveys Developer Guide (for Annual School Surveys)
- Excel Workbook Developer Guide (for Annual School Surveys)
- JasperReports Developer Guide (for reports)
Operating System
Currently only the Windows operating system is supported. The application can be installed on any recent version of the Windows operating system.
- Windows Server 2022, 2019, 2016, 2012
- Windows 11, 10, 8, 7
If this is a first time trying this out it is recommended to try on a test virtual machine. VirtualBox is a free virtualisation technology great for trying this on your personal machine.
Database Engine Installation
The only database engine currently supported is Microsoft SQL Server (SQL Server) with most deployments tested with the following versions:
- SQL Server 2012 (including Express Edition)
- SQL Server 2014 (including Express Edition)
- SQL Server 2019 (including Express Edition)
- SQL Server 2022 (including Express Edition)
Though it should work with anything above SQL Server 2012. At times the requirements was upgraded to make use of newer functions available in later versions of SQL Server. One such instance is documented in this issue.
There is no need for an expensive license, the Express edition which is freely available will work fine for most small countries. If you don't have already a commercial license download the free version MS SQL Server Express. Any of the files would have the required minimal database engine but might has well download the 64bit full version called ENU\x64\SQLEXPRADV_x64_ENU.exe. Double click and follow through the installation. Choosing the default values is a good start and reboot the system when done.
The following databases distributed with the source code in the folder databases:
- IdentifiesP.bak: a database that handles the users, permissions and customization of the navigation menus.
- pacificemisdb.bak: the primary database containing all the tables, views, stored procedures and functions but with no data at all.
- pacificemisdb-withsamplelookups.bak: the primary database containing all the tables, views, stored procedures and functions with some sample data particularly common lookup data and meta data for basic configuration.
Restoring a database from a backup is documented here. Take note of the names of your new databases and also the name of the server (e.g. LOCALHOST, HOSTNAME\SQLEXPRESS) you will need those next.
Programming Language
The programming language on the backend (i.e. Pineapples, Pineapples.Data, Pineapples.Data.Test) is C# using ASP.NET4.6 framework. The frontend (i.e. Pineapples.Client) is made up of HTML, CSS, Javascript and TypeScript with the Angular 1 framework. All Javascript code is being migrated slowly to TypeScript as changes are done to it or new code is written.
Built Tools and Package Manager
A collection of auxiliary tools not part of the actual application but used in automating deployment, frontend package management, etc. are also used:
- NodeJS is the platform used to run Javascript on the server. It is necessary to run the other tools (i.e. npm, grunt, bower). This is not part of the application once deployed but used on the developer's workstation only.
- NPM will be installed with NodeJS above. It is the package manager and is used mainly to install grunt plugins and other tools used by the frontend such as testing framework. Those packages are not part of the actual application in deployment but are used mainly on the developer's machine in
Pineapples.Client\node_modules\.
- Bower will be installed globally using
npm. All dependencies on 3rd party components *used in the browser* are managed using bower. Those components that do not support bower, are still added intobower.jsonwith a reference to their source URL. Thebower_componentsfolder is not in source control, since its contents are entirely determined bybower.json.
- GruntJS is used to automate various frontend task such as testing, linting, building, etc. The
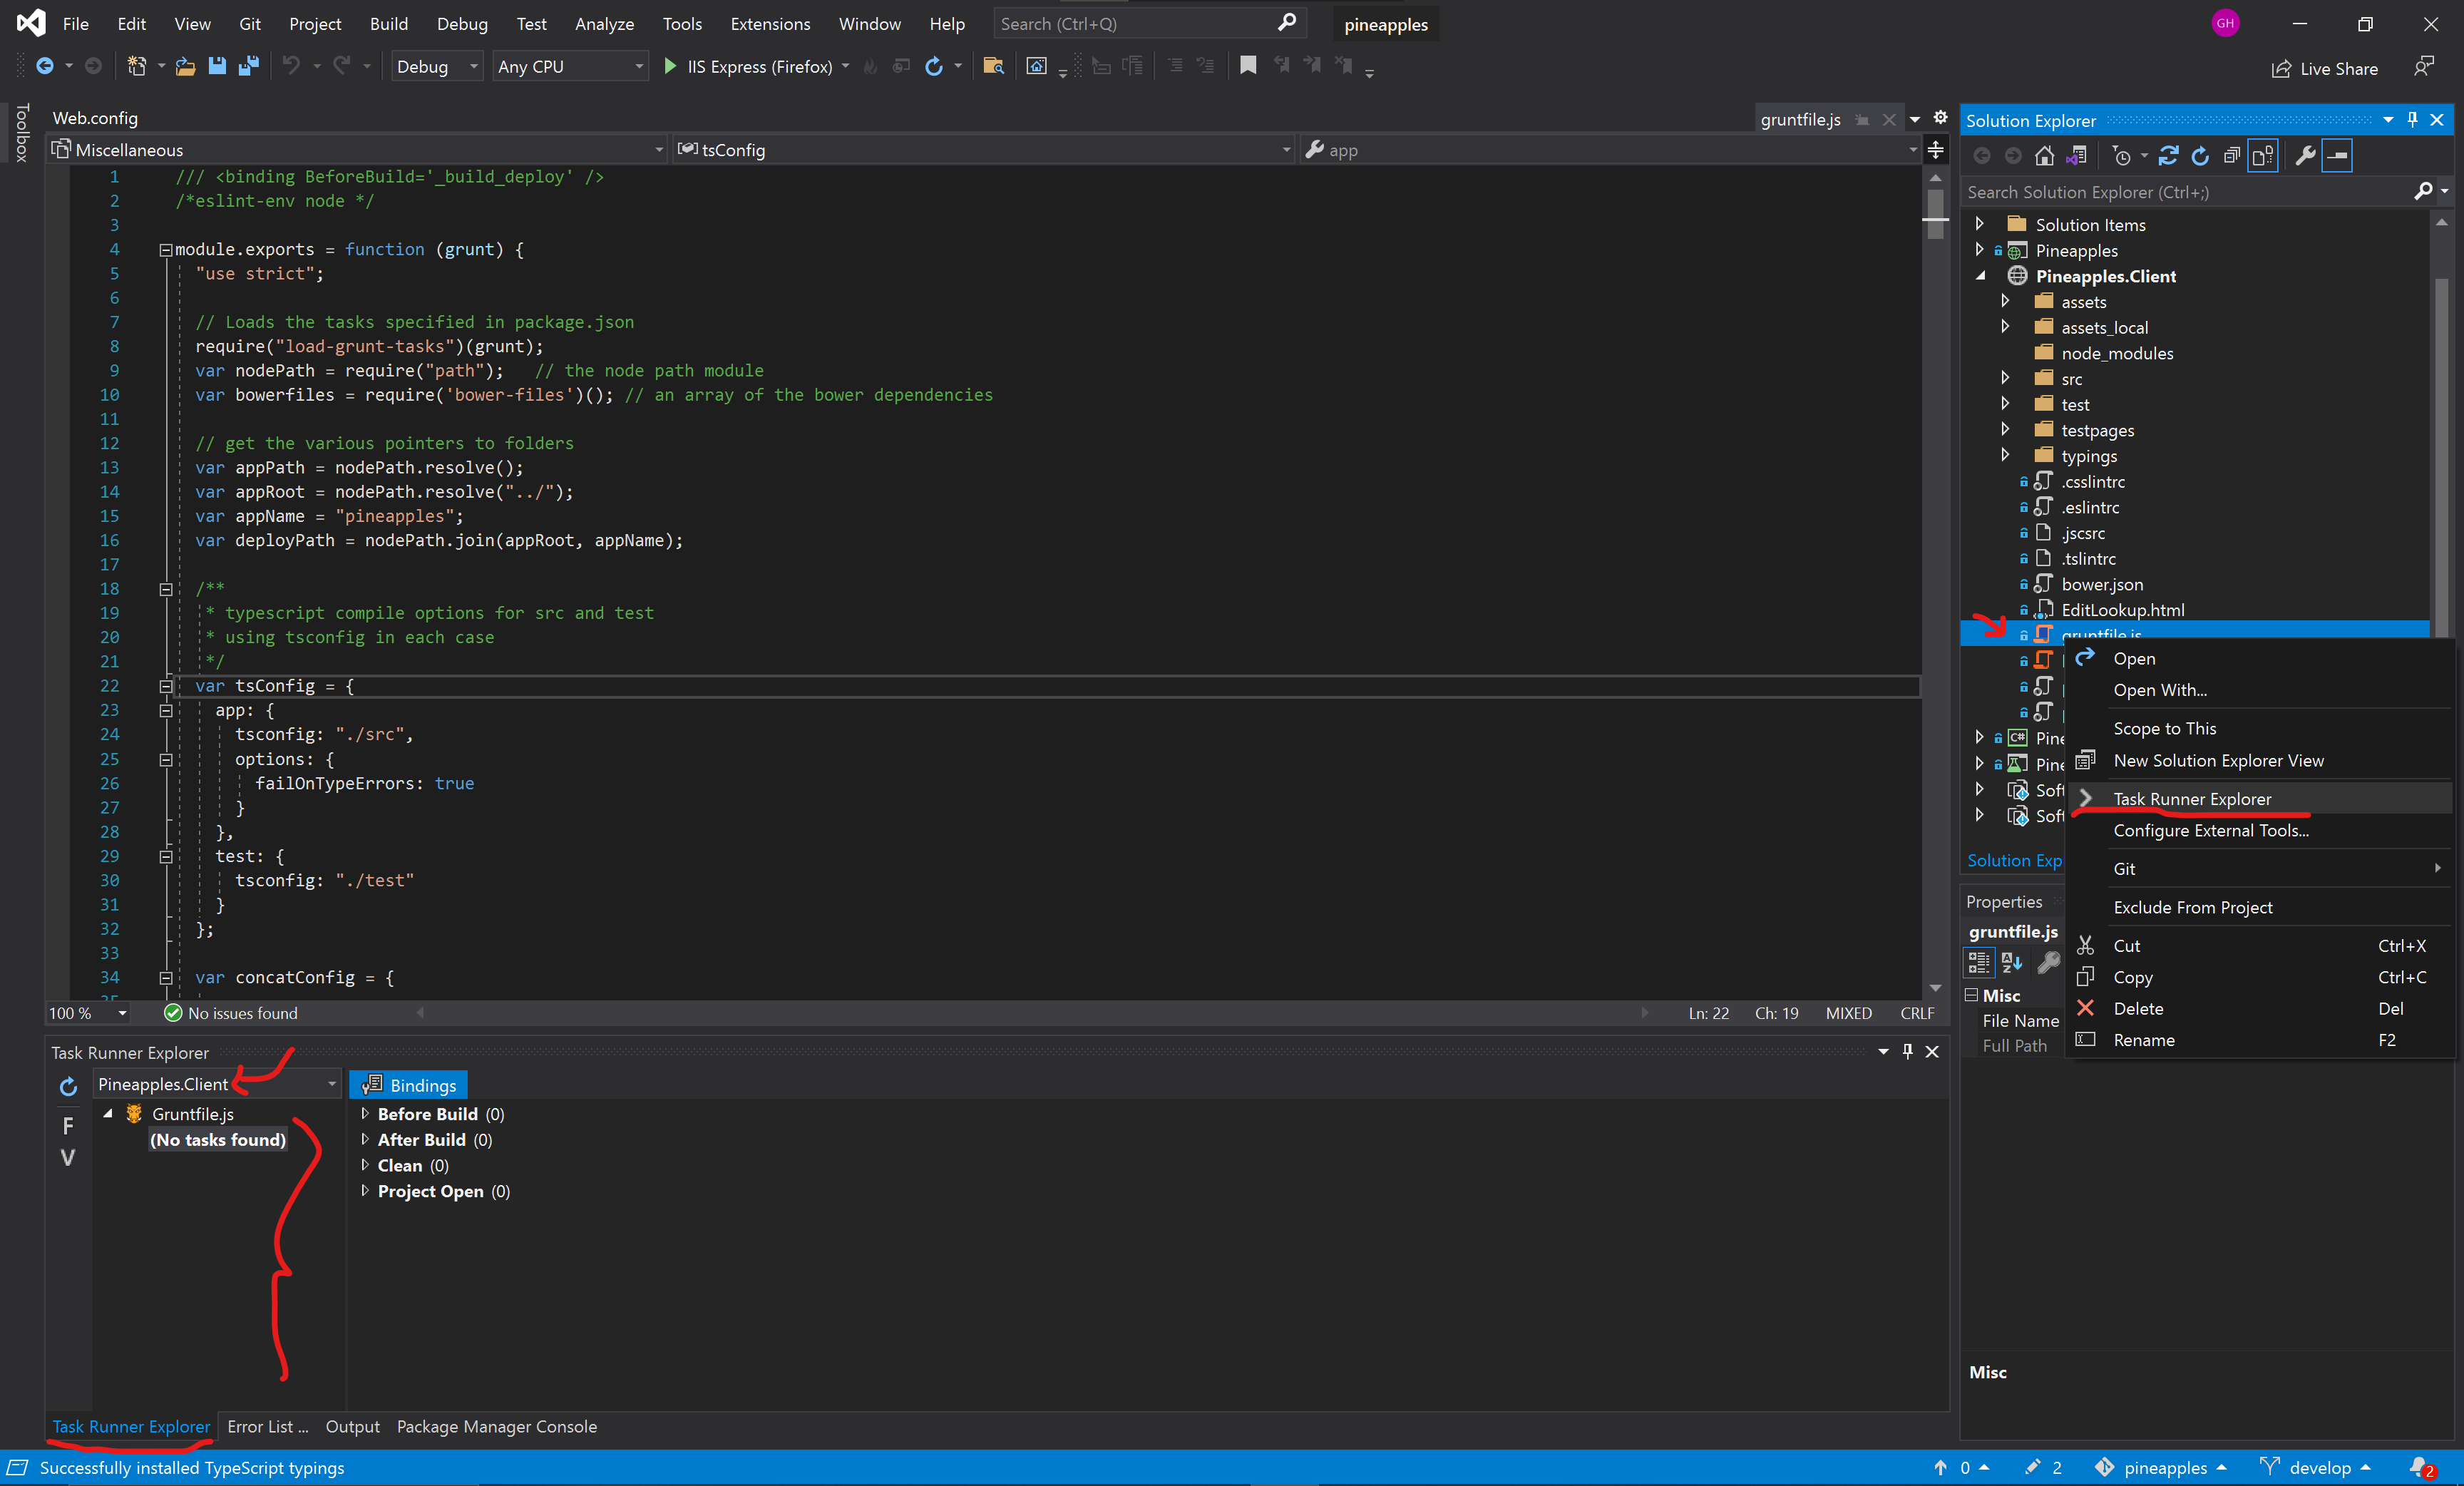
gruntfile.jscontains all the configuration for the project management tasks. These are accessed in Visual Studio from the Task Runner Explorer window. The two most important tasks are “build” and “deploy” or “_build_deploy” to run one after the other. Careful review of the Gruntfile.js must be done to understand what it does as this will be constantly improving. Essentially, it gathers all files that will go into the browser (i.e. Javascript, CSS, images, fonts) and prepares them for being served by the ASP.NET application. It puts most of them in a temporaryPineapples.Client\dist\folder that is cleaned and recreated on each build.
Setting Up the Development Environment
The easiest way to get a development environment and start developing on the Pacific EMIS is on Windows with instructions below.
Download and Install the Main Development Tools
Most developers currently use Visual Studio, ASP.NET4.6 (comes with Visual Studio), MS SQL Server Express or Developer Edition, IIS, NodeJS/NPM and SourceTree/Git. Here are the steps assuming you have a working Windows operating system (version 7, 8, or 10):
- Download and install Git
- Download and install Visual Studio (better tested with 2019).
- Download and install MS SQL Server Developer (better tested with 2019; at least one developer uses 2022 without issues).
- Download and install latest MS SQL Management Studio
- Download and install most recent version 16 LTS NodeJS. A reboot may be necessary if you also install all the build tools through the installer.
- Install Bower from the command line you can simply
> npm install -g bower. - Install Grunt from the command line you can simply
> npm install -g grunt-cli. - Download and install SourceTree (useful for Git).
Software Configuration Management
All software is managed through Git (Version Control Management) and currently Bitbucket (Issue tracking, collaboration, etc.) in a open source publicly accessible repository. Its location is currently at https://bitbucket.org/softwords/pineapples.
The repository can be loaded on your local machine using a number of way such as with SourceTree, Git on the command line or other tools that support Git.
SourceTree Method
This method is more visual using a graphical user interface on top of Git. Follow this guide to use SourceTree to clone your local copy into a place of your choice (e.g. C:\Users\user\Development\repositories\).
In short, your cloning in SourceTree could look something like the following. It is better to checkout develop as this is where the stable source code leaves. Once you get this working on develop then you can start creating branches for to develop new code.

Git Command Line Method
Directly in the command line using Git only.
> cd C:\
> git clone https://ghachey@bitbucket.org/softwords/pineapples.git
Install the frontend dependencies
On first time setup I have had more success to installing the frontend dependencies first in the command line. Open a command line and browse to the ``Pineapples.Client`` folder and execute the following.
> bower install
A successful run for the first time should look something like shown below.

Then a local version of grunt seems to be needed to silence an error in Visual Studio later. Again, from the command line go into the ``pineapples`` root folder (not ``Pineapples.Client``) and issue the following command.
> npm install grunt
Then install a locale version of grunt and all the dependencies in the ``Pineapples.Client``.
> npm install grunt
> npm install
Loading the Solution into Visual Studio
Start Visual Studio (VS) and click on Open - Project/Solution…. Locate the solution file at the root of the cloned repository downloaded on your local machine in the previous step. This will open the solution (and its projects) into VS.

You can then verify if VS is actually using the node and npm binaries you think they were by opening Tools - NuGet Package Manager - Package Manager Console and typing the following commands and observing the output. The version should be the one you installed manually above (and not the one in the screenshot).

As a one time thing, you need to set/verify the starting project of the solution. Right click on the Pineapples project in the Solution Explorer and click on Set as StartUp project. The ``Pineapples`` project should from now on become bold.
At this point if you followed closely the previous sections you should already be able to right click on the Solution 'pineapples' and click Build Solution. The first time around this will require the downloading of all the NuGet packages (npm and bower dependencies would have already been pulled, at least on a good working Internet connection). It should build 4 projects without errors.
You should then try running the grunt task _build_deploy as shown below. Run it a couple of times for good measure.

If you do not yet see the Task Runner Explorer window you can bring it up by right clicking on the file ``Pineapples.Client → gruntfile.js`` and then clicking on ``Task Runner Explorer`` as shown below.
Application Configuration
The main configuration for the application is the file Web.config from the Pineaples project. There are a few things that need to be configured before you can run the application. The relevant parts of the Web.config configuration file are detailed here.
You will need to setup two databases: the Identity database (i.e. IdentitiesP) and the application's main database (e.g. MIEMIS, SIEMIS, SIEMIS-TEST, KIEMIS). You should have those already in your MS SQL Server as detailed in previous section.
Replace localhost with your server name and SQL server instance name (e.g. MACHINENAME, MACHINENAME\SQLEXPRESS). The appSettings's database needs to be the one you want to work with (e.g. MIEMIS-TEST). The context is not the same as the database but would be the place app name (e.g. miemis, kemis, siemis, fedemis)
<add name="DefaultConnection" connectionString="Data Source=localhost;Initial Catalog=IdentitiesP;...
<appSettings>
  <add key="server" value="localhost" />
  <add key="database" value="siemis" />
  <add key="context" value="siemis" />
  <add key="title" value="FedEMIS Online" />
  ...
</appSettings>
There are other appSettings less critical but important for some functionalities.
<appSettings>
  ...
  <!-- The report server configuration for the reporting functionality -->
  <add key="ReportServerUrl" value="http://localhost:8080/reportserver" />
  <add key="jasperUrl" value="http://data.pss.edu.mh:8080/jasperserver" />
  <add key="jasperUser" value="jasperadmin" />
  <add key="jasperPass" value="Adm1n2p$$16!" />
  ...
  <!-- The location where files are stored on the computer used by a number of features in the system -->
  <add key="FileDb" value="C:\files\miemis\filedb" />
  ...
  <!-- Emailing functionality cnofiguration -->
  <add key="emailSenderName" value="EMIS Web Administrator" />
  <add key="emailSenderAddress" value="no-reply@national.doe.fm" />
  <!-- use the your own email if you want to test receiving systems emails (e.g. errors notifications) -->
  <add key="emailReceiverAddress" value="ghachey@nuzusys.com" />
  <!-- use the bc for testing, so that a copy of all outbound emails is sent to this address -->
  <!--<add key="emailBcc" value="edemisaudit@softwords.com.au" />-->
  ...
</appSettings>
And finally, for email notifications to work it must be configured to use a email server. Various approaches can be used, perhaps the easiest is to use a Gmail account with an application password.
  <system.net>
    <mailSettings>
      <!-- settings for email delivery using smtp client
      will vary according to the sender - refer to sysadmin docs at
      http://docs.pacific-emis.org/doku.php?id=systems_administrator_manual#setting_up_email-->
      <!-- Using a Google account is an easy and reliable way.
           this may require that you "Access for less secure apps"
           be enabled for the Gmail account used by the NetworkCredential
           see https://www.google.com/settings/u/1/security/lesssecureapps -->
      <smtp deliveryMethod="Network">
        <network host="smtp.gmail.com" port="587"
                 userName="youremail@gmail.com" password="yourapppassword"
                 defaultCredentials="false" enableSsl="true" />
      </smtp>
    </mailSettings>
  </system.net>
Running the Solution
At this point you should be ready to run the system by clicking on the following. Note that below was first set to Google Chrome but it could be started within any browser.

[Optional] Various Visual Studio Configuration
If you are interested in actual developing some code there are conventions established that must be followed. Here are some configuration you should be.
Make sure Visual Studio restores latest packages for the frontend on Startup
This is probably a useful setting to keep the frontend dependencies updated with the code base.

Tab vs Spaces Setup
Spaces are now to be used instead of tabs. They work better in a world where AI is heavily used. Developers of Pacific EMIS has agreed on:
- C#: 4 spaces
- Everything else (CSS/Javascript/TypeScript): 2 spaces
This configuration is enforced using a .editorconfig right in the root of the repository.
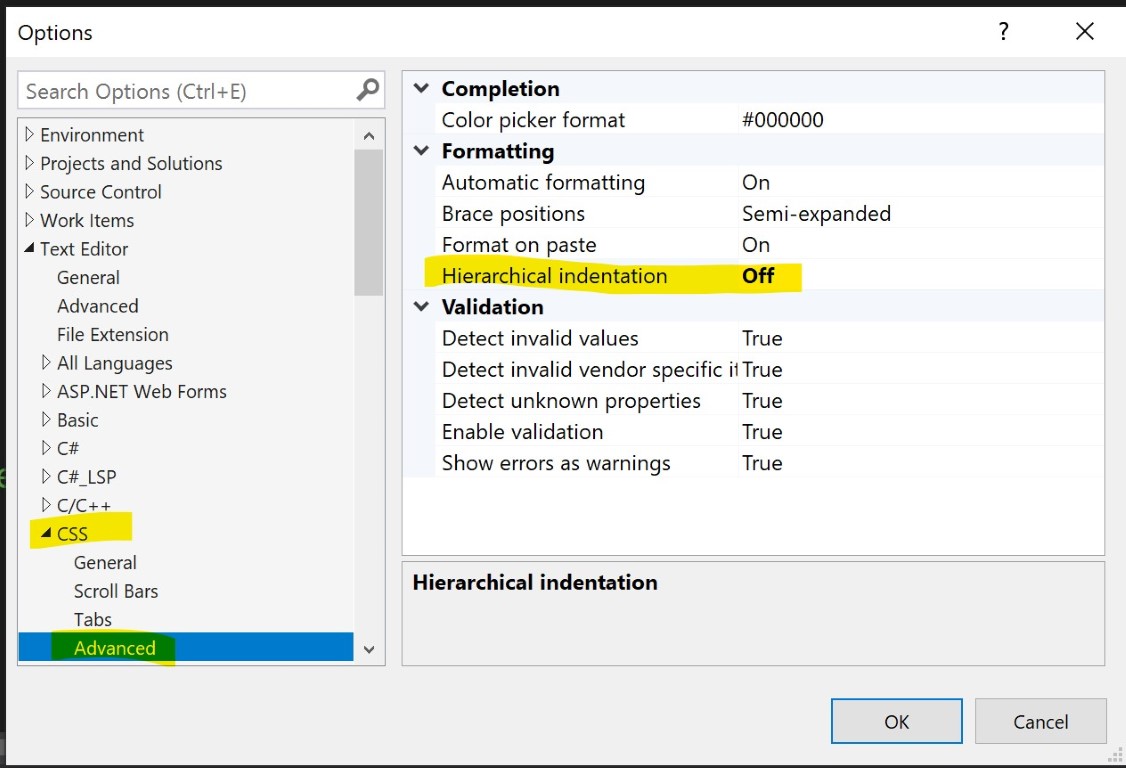
CSS you can turn off the hierarchical indentation.
Troubleshooting Visual Studio Build/Run Errors
Many things can go wrong in software development. Some common errors are documented here.
Verifying Dependencies
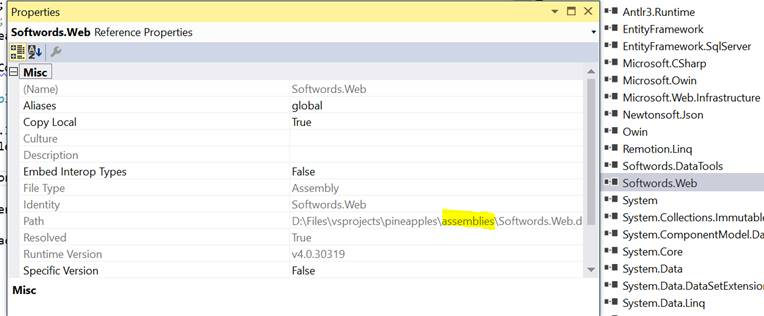
Make sure all projects have their dependencies sorted. Start with Pineapples.Data project. Ensure that the references to Softwords.Datatools, Softwords.Web and Softword.Redirector are present and point to the assemblies folder:
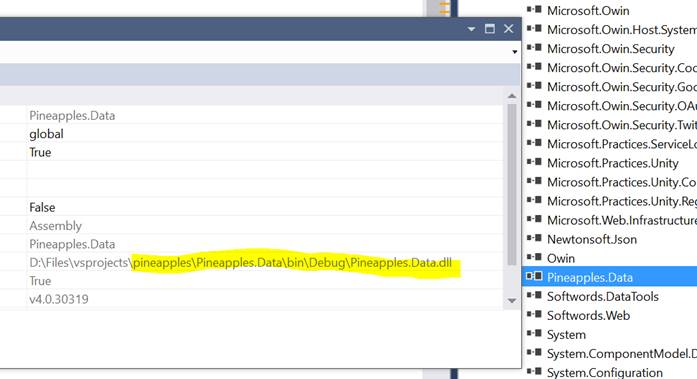
Ensure all references are present. Build Pineapples.Data, confirm it Succeeds. Move to Pineapples project. Check the references as above. Also check there is a reference to Pineapples.Data, and it points to the current project in the solution:
Check in particular that reference to Microsoft.Practices.Unity are resolved. These come from Nuget and should be available. Build the project Pineapples, then Build Solution. This should have the effect of running the gruntfile _build_deploy task, which is linked to the build of Pineapples.Client (which otherwise there is no need to build). You can of course run the gruntfile _build_deploy task on its own, for instance if you develop only on the client side (i.e. CSS, Javascript, TypeScript).
Frontend dependencies missing
An error that seems to pop up now and then on first time Run looks like below.

This usually happens in the case of incomplete build/deploy of assets. The most likely scenario for this is that bower did not get all the client side dependencies. There could be a number of reasons for this.
- Internet problem
- Bower not installed or configure correctly
- Bower not available on the PATH from command line and/or visual studio
In this case, go back to the step of installing bower and the frontend dependencies using bower above.
Useful Development Tools and Techniques
While these tools and techniques are optional they can greatly enhanced your development productivity. There are certainly other alternative tools and techniques that can be used but those are the ones used by current developers at the time of this writing.
Push changes in code automatically into running browser instance
In Visual Studio, ensure that the Browser Link and Browser Reload On Save addins are installed as shown below.

Follow the instructions on of the addin to configure. So long as it reloads on change to js or cshtml it will cover most circumstances. When you _build_deploy Pineapples.Client it will force the browser to reload.
To avoid starting a new browser instance of pineapples every time you start the app, in Pineapples project Properties, change the Web Start Action to Don't open a page

If you do not open a page, you will need to start at least one page by navigating to localhost:52206. Thereafter, you can rebuild the client components with _build_deploy, or stop and restart the application (i.e. rebuild Pineapples project) and continue to work in your existing browser instance.
Other than the change to this option in the Pineapples project file Pineapples.csproj, the changes described here affect the developer's Visual Studio configuration, not the source code base.
Enabling Debugging of TypeScript in Visual Studio and/or Chrome Developer
To use typescript debugging in Visual Studio, the option Enable Javascript debugging for ASP.NET must be selected:

In Chrome, you have to you use FileSystem option in the Sources page to allow access to the source code directory pineapples.client/src
Chrome is possibly a more effective option because VS does not correctly interpret this in the typescript (i.e. inside a lambda function) while Chrome does. Furthermore, it can be more practical to have client side debugging and server side debugging in separate windows on separate screens.

Development Work-flow
The Pacific EMIS project constantly strives to improve its development operations in order to produce software of higher quality at a more efficient rate. This part of the developer guide will undoubtably change and should be kept close at hand when developing on this project.
Frontend Development Tools
The application is tested using the Chrome web browser which has good developer tools out of the box. For more advanced debugging of the frontend the developers mostly use Fiddler. If you have not done so already install and start Fiddler. As a one time thing you can click on WinConfig to make sure Windows does not interfere with traffic capture.

To eliminate all the noise of using fiddler as a proxy you can filter to only show connections to specific hosts, in our case we will include the two default hosts that VS will run the development version of the web application using the IIS express web server. That is, hosts localhost:52206 for HTTP connections and localhost:44301 for HTTPS connections. Can can be done as shown in the following illustration.

Since we are developing an application that runs through HTTPS encrypted channel it is useful to decrypt this traffic in fiddler so it can actually be examined and used for troubleshooting and development. Click Fiddler's Tools - Options and the HTTPS tab as shown below.

This should you started with this very useful in analyzing all your web application traffic.
If you have issues with using Skype with Fiddler running refer to image below for a workaround.

Contributing Code General Workflow
In general all contributions by third parties should be done through forking the public repository, creating a local branch to work on based on the issue that is assigned to you, creating a pull request back to the original repository.
Forking the Public Repository
To fork you must first be logged on your Bitbucket repository. Point the browser to the https://bitbucket.org/softwords/pineapples URL and the click on the + as shown below.

Then Fork this repository as below.

Then fork with the following settings.

You should see it now under your own username as shown underlined below. Make sure you have SourceTree installed and click clone in SourceTree.

You should checkout the branch develop as below.

You are now ready to start working on your own copy of the pineapples repository. More on forking with bitbucket can be found at https://confluence.atlassian.com/bitbucket/forking-a-repository-221449527.html.
Creating Branch on your New Local Repository
Our normal process is we have issues in the issue tracking system. Contributors are typically assigned issues as shown below.

In that example, Brian Lewis would create a branch called issue354 and work on that for that particular issue (e.g. a bug fix, a new feature, etc.)
Creating a Pull Request back to Original Repository
Before you can create a pull request back into original repository there are 2 things you need to prepare.
1) The original repository may have evolved. You would need to pull that inside your own stuff to make yourself in sync again. You are responsible for that.
2) Once in sync you need to consolidate your PR into a single commit with a commit message following our standard. Refer to the section below “Commit Message Format Rules”
The core developers can help with this preparation if you are not an experience Git user.
Once your new shinny work is ready to go back to the original pineapples repository you can create your pull request.
TODO Screenshot how to do this.
More on creating a pull request with bitbucket is available at https://confluence.atlassian.com/bitbucket/create-a-pull-request-to-merge-your-change-774243413.html
Database Schema Changes
Database schema migration are currently done more or less manually with the help of a proprietary tool called SQLDelta. Currently there is only the most current schema available and it is not easy to revert to older schemas from previous releases. So it is important to stay up-to-date. The database schema of the developer can be made up-to-date by syncing with the master reference database
 - Include steps and a simple schema upgrade with screenshots
Note that when you make schema changes, you should run the SP “common.afterschemaupgrade” which recompiles all views and stored procs.
SQLDelta Configuration
As a project some configurations are adopted by convention. Here they will be documented as we come across them.
- Slow Connection: Yes
- Ignore Comments: No
- Post Script: exec common.afterschemaupgrade
Some of the common project configurations used by developers on this projects are changed from the default of SQLDelta. The easiest way is to contact one of the core developers and get them to to a save and you can load the configuration into your own projects.
To protect the loss of users information on the canonical pineapples_develop database that hosts the master schema of the SQL database the following global project setting can be used.

Testing Code
Currently not a lot of test is being done, but eventually all new branches doing into origin/develop with new features or bug fixes should contain respective units test at a minimum testing the new feature or the bug being fix.
develop this section further as we move forward. Here are some notes to get started:
- karma test infrastructure is in place in the grunt file. unit test are added into the test folder. Ad-hoc test pages can be stored in testpages. these can be run in IIS Express, which is started with the grunt task iisexpress:server.
- establish and start to enforce lint standards in the typescript and javascript code (and hopefully in c# somehow)
- move to a test-driven methodology, and accrue regression test suites both for the C# code, and the angular code.
High Level Architecture
To recap what was already introduced in Introduction here is what the repository of the Pacific EMIS looks like.
Data Retrieval Service
The architecture of the data retrieval service is shown below.
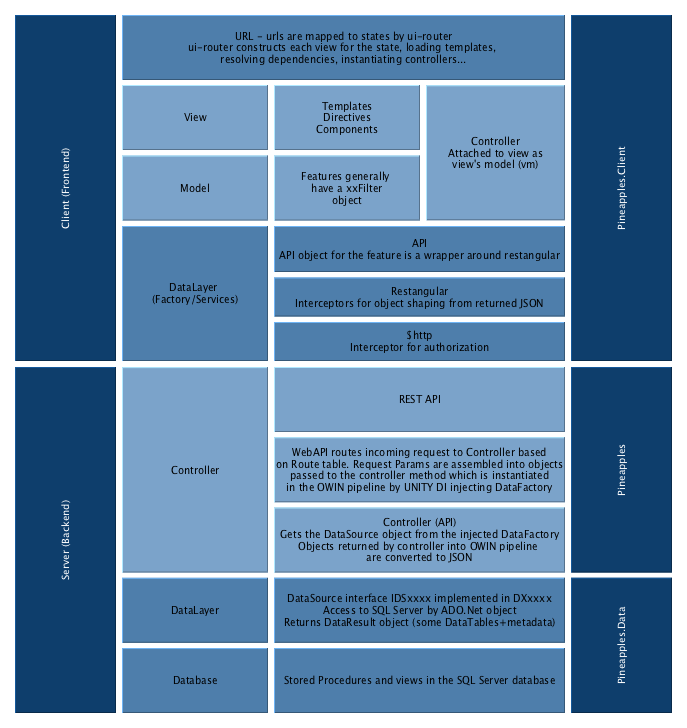
And here is a short discussion regarding the use of Entity Framework 6 vs. ADO.NET by the project main software architect, Brian Lewis.
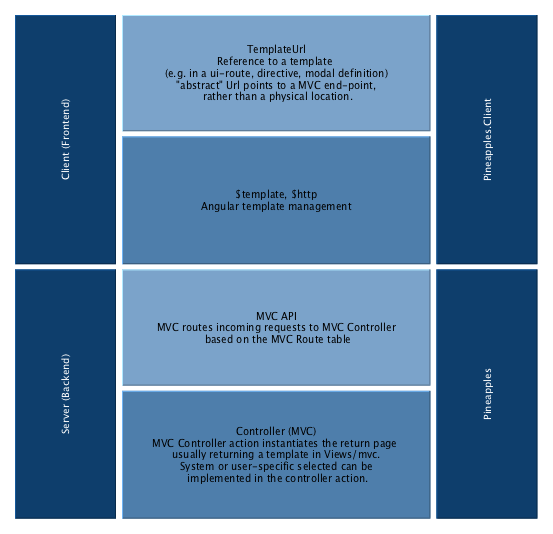
Templates
The architecture of templates is shown below.
Theme (Look and Feel)
Currently a little messy. Started out with a paid theme based on bootstrap now a lot of it is out and just building with HTML and CSS “left overs” from the theme. The current idea on the road map would be to move to a full Angular Material based interface to provide a professional consistent UI.
Navigation and Module System
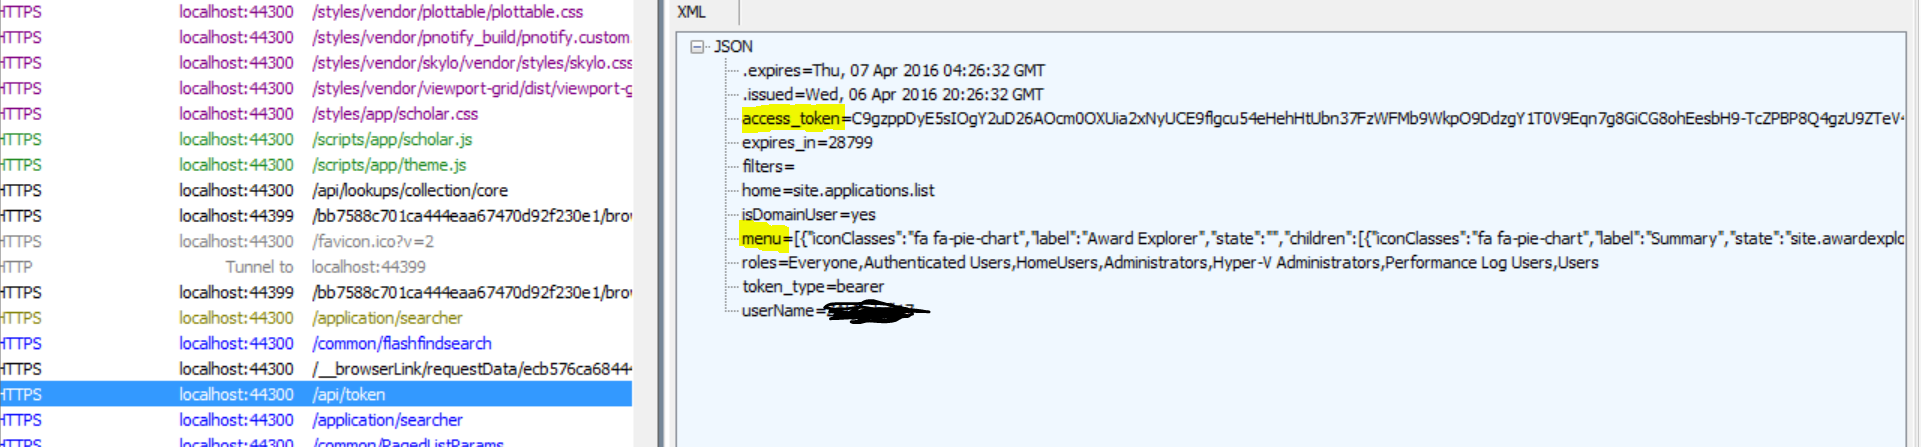
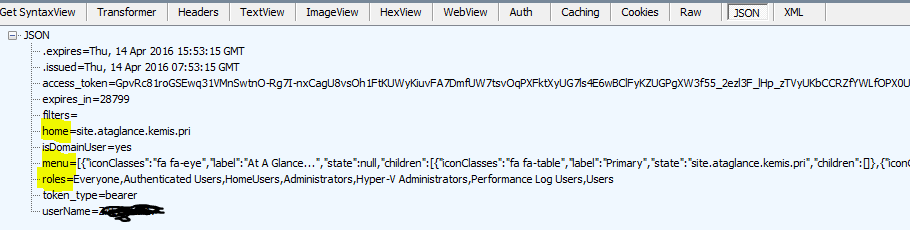
The Navigation menu in the side bar is loaded when the user logs in.
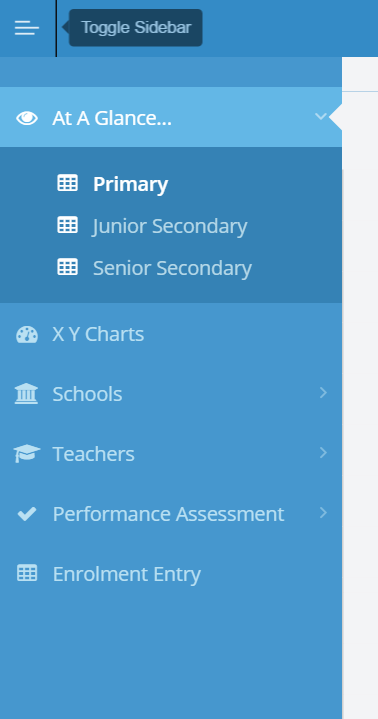
It is part of the packet of data returned with the BearerToken in response to api/token.
Both the menu and the home_site are picked up from the server from a *MenuKey* associated to the user. For ASP.NET identity accounts, this is on AspNetUsers table. For domain accounts, this is set to the default ALL. The MenuKey points into the table Navigation in IndentitiesP (i.e. the ASP.NET Identity database).
There are 3 types of entries in the IdentitiesP's dbo.Navigation table
- Those like ALL, which represent a menu that may be assigned to a user
- Submenus, that are parents of a collection of function (e.g. schools)
- End points that are a specific system function (e.g. schools.list)
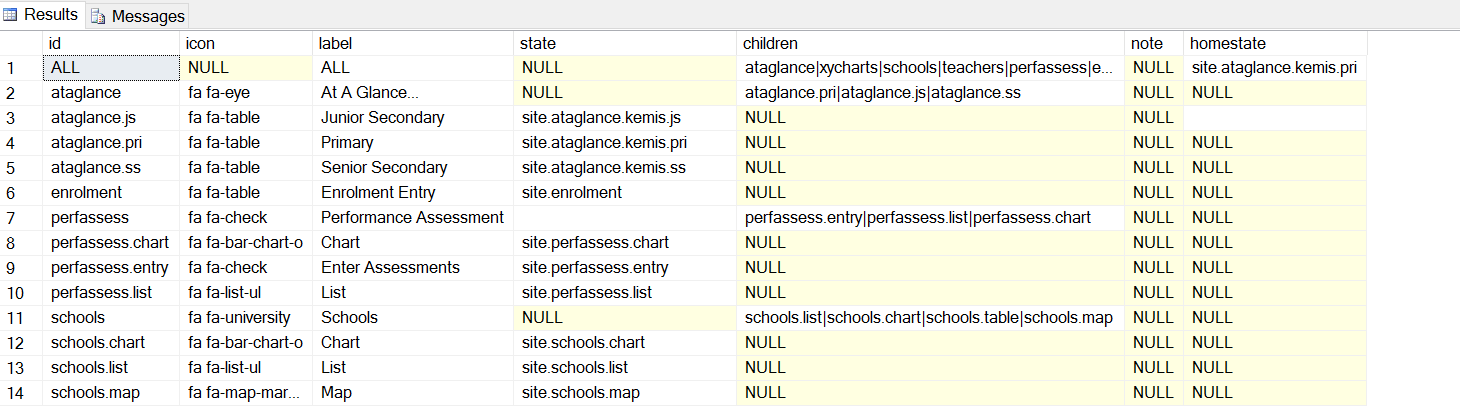
And is a brief description of its columns
- Icon: this is fontawesome coding for the icon to show on that menu.
- Label: text for the menu item
- State: for functions, this is the ui-router state to go to when that function is selected. Obviously, these need to be defined in the Javascript/Typescript code. Most features have a routine that will define these routes.
- Children: for menu parents, a pipe-separated list of the IDs of its children. This can be recursive, but currently, these children are all end-points–entries that point to a state.
- homestate: the starting state when the user logs in. When you navigate to the state site.home, you are redirected to this state.
Roles are sent to the client. For ASP.NET users, these come from the IdentitiesP database. For domain users, it is just currently a list of ActiveDirectory groups. A role can be associated to a ui-route on the client. Access to that route can be dependent on belonging to the Role. (Note that even if a route is not exposed through the menu, you can still navigate to it if you know its URL.) This is managed by the component *angular-permission*.
Also sent to the client are *Filters*. These are restrictions on what a user may select in the searcher pages. For example, a filter of *District=DC* will mean that the Province dropdowns will be locked to province *DC* (note that this is ultimately enforced on the server based on the bearer token.) Filters are set up in ASP.NET Identity as Claims:
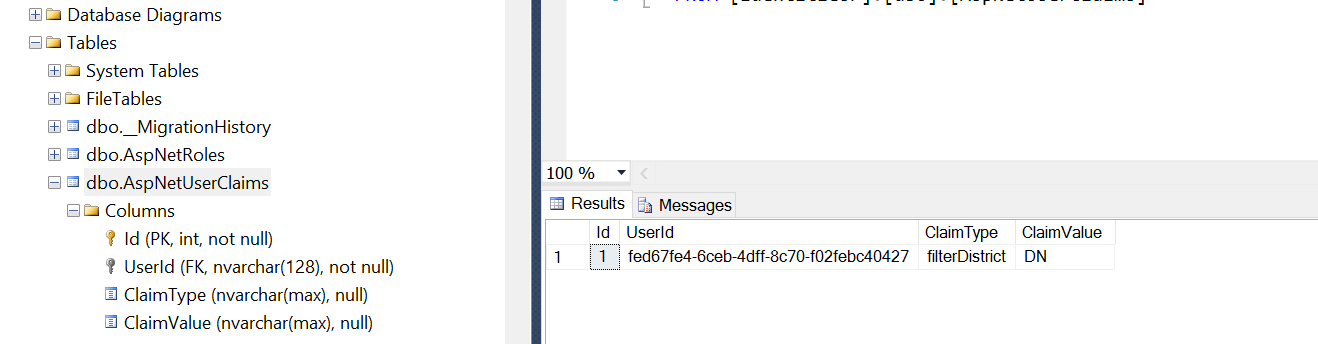
Menu filter and roles are sent to the client at login, but are also encapsulated as Roles and Claims in the bearer token. Their use on the client is more a courtesy than a security feature: on the client, we don’t show the user things that they will not be able to do on the server, where the Claim is enforced based on the token.
We need to better integrate the Roles, Filters and menu that are retrieved for a user who authenticates against Active Directory. This is important in Solomon Islands for example, where we will need to distinguish between users logging in to the the government domain. Brian suggest that this will be some data-driven mapping between Active Directory groups, and some abstract ASP.NET Identity account representing that group. So at login, if you are identified as belonging to some specified AD group, you will get the MenuKey, Filters and Roles associated to that group.
Lookups and Configuration
The Pacific EMIS is mainly configured and adapted to different countries through lookups in the database. Along side this document is kept a spreadsheet called PineapplesLookups which details all the lookups. Those must be understood and customized for any new deployment.
Most lookups can already be configured directly from the web app. But adding any missing one is easy. The process is outline here:
- In Sql Server make sure the table has the ‘ChangeTracked’ fields: i.e.
pCreateUser,pCreateDateTime,pEditUser,pEditDateTime,pRowversion - Create a model in
Pineapples.Datafor the table. You can use the POCOGenerator tool for this, or may be possible to inherit fromSimpleCodeTableorSequencedCodeTable. Add a table [Description] attribute to get this in the lookups editor. Also note if you ultimately want to get a dropdown list of some other lookup in the editor grid, add the [ClientLookup] attribute to the field. The better this class is defined by attributes, the better the result will be. - Change the primary key to code (string) or ID(int) and rely on the [Column] attribute to map this to the correct field name.
- Add the new entity collection to
PineapplesEFContext - In Pineapples, add a new controller for this object to
controllers_apiorcontrollers_api/lookupsChoice depends on whether this is a ‘lookup;’ table or an application entity (e.g. for authorities, I’d go with controllers_api). This controller should inherit fromTableMaintenanceController. Typically you’ll copy and modify an existing one, so be careful to set up all the generic parameters correctly, for the data type of the key etc., check the [RoutePrefrix] also. - To get this to be editable in
#!/tables, add the new controller name toLookupsController.editableTables. This is the source of the dropdown list of editable tables in#!/tables. - This should now work. You’ll get a default viewMode constructed from the table definition. This will respect data types and sizes to give a good approximation. You can override this by putting a customised viewmode into the ViewModes folder. Simpest way to do this is to generate the automatic one, capture the result (e.g. from Fiddler) and edit it.
Troubleshooting: use fiddler to make sure that you are getting the correct api calls generated for your entity type. Be especially careful that a PUT should include the primary key value e.g. api/authorities/foo. If you are not getting the primary key in the url, check step 3. (and note how this relates to getIdFromElem in ConfigRestangularPinappples).
In summary, this is built on communication between Restangular, Web Api and EntityFramework. The reusable plumbing is implemented in the TableMaintenanceController base class, and the DynamicBinder<> generic
Note on Report Parameters
While JasperServer is where the reports are stored and run they can be accessed through a RESTful API. The Pacific EMIS can automatically integrate all published reports in a JasperServer for a professional unified UI design. The way this works in Pacific online is that the Context you are running the report in (e.g. from an individual school) will supply report parameters with specific names if they are required. For eample, from the new Reports tab within a particular School it will try to push a parameter ‘SchoolNo’ containing the current school’s ID instead of the user having to manually enter the SchoolNo for which the report is sought.
If there are any parameters required that are not supplied, you’ll get a dialog to prompt for all parameters, with any that can be supplied already filled in. So on this basis, if your reports use other parameter names, they will still run in Pacific EMIS, but you will have to key in the parameters (just as you would in Jasper server); you won’t get them supplied.
The dialog displayed in Pacific EMIS Online will also respect any dropdown list associated with a Jasper Input Control attached to the report. So the aim is to have a collection of such input controls and queries set up in common in all our Jasper installations. In fact these will be the same queries and names as used in the Lookups within Pacific EMIS Online.
Note on Polymorphism in the UI
This comes into play various places such as part of handling of school accreditations and Wash surveys imported from tablet or annual school census aggregate surveys filled up online.
For school inspections (school accreditation, WASH surveys, etc.) polymorphism is handled in the schoolinspection component, by defining a template that in turn loads (via ng-include) another template based on the inspectionType. The same polymorphic UI is used to display different “Form B” implementations, and different UI for Xml survey contents. These families of templates are held in specific folder locations:
- schoolinspection/inspectiontype: holds the UI for various schoolinspections, by type. Invoked from the schoolinspections item states.
- schoolinspection/survey: holds the UI for various survey Xml as collected by the tablet, and stored into inspXml on SchoolInspections. These are also named via inspectiontype, and are used in both schoolinspection and cloudfile UI.
- schoolaccreditation/formb : Form B implementations. Used by cloudfiles, schoolaccreditations, schoolinspections.
Note that the usual methods for creating context-specific versions of all these templates still apply. This is of aprticular importance for FormB for example.
Note on School Inspections
The school inspection framework of the EMIS is designed to enable various types of school inspections (surveys). Typically the data will be loaded either from the Pacific EMIS Education Survey Tool or Kobotoolbox developed surveys. They can then be loaded into the EMIS and accessed there for viewing, analysis and reporting.
However, sooner or later you may need to
- Delete some erroneously loaded school inspections. For this use the updateable view [pInspectionRead].[SchoolInspections].
- Bulk load some table like data (which would need to be converted to XML for school inspection for example). TODO
Technology Documentation
Various approaches and tools used by the developers of this project are documented here.
SQL Server Notes
Indexes
In Sql Server, a CLUSTERED index on a table means that the physical records are sorted according to the order of that index. This means that when reading a range of records from the index - say, from 'C' → 'F' ; all the required records in the table willl be contiguous, making it faster to read them.
Downside is that when a new record is written, or when a key is changed, the record needs to be inserted in the table, it has to be placed in its correct place in the sequence. If the clustered index is based on an Identity, this is not a problem - the new key is always at the end, and the key is never changed. But if the key is a uniqueidentifier; as it is on Student_ ; then keys are not allocated in sequence, so new records need to get inserted into their correct place, which can mean every insert results in a large part of the table being rewritten ( to make the space available for the insert).
RULE: indexes based on uniqueidentifiers should not be CLUSTERED!
This is a bit of a trap, because SSMS always defaults the primary key to CLUSTERED, even if it is a uniqueidentifier. Always worth checking this when building a new table: which index - if any - should be the clustered index?
Useful Stored Procedures
Will be documented here as we come across them. But there are much more then what is listed here and best to skim through them in the DB.
common.findText
Stored procedure which will identify occurrences of a string in the text of a view, stored proc, function etc. This is useful for finding unsuspected references to a table name or view name e.g.
common.findText 'lkpEdEnvironment'
common.findText 'lkpEdEnvironment', 'warehouse'
common.findText 'lkpEdEnvironment', 'warehouse','V'
Object to Relational Data Mapping
Originally pineapples made us of Linq2SQL but has since moved to EF6. Key differences in moving to Entity Framework from Linq2Sql:
L2S use the custom dbml designer to build its model of the database. EF uses explicit, and simpler, classes:
- context class - the overarching data “context” PineapplesEFContext.
- entity classes - one class for each entity , correspond to database tables basically. These classes are now in Pineapples.Data.Models; e.g. Books.cs
The context class contains a collection property for each entity e.g. cxt.Books. While called 'POCO' classes (= 'plain old c# objects') they are not really that 'POCO' : they are decorated with lots of attributes used by EF when accessing this data. How to generate these classes since now we don't have the Linq2Sql designer any more?
We use this tool POCO-Generator
It generates everything we need it to do, its failing is that it can be quite slow on a big database (parsing the entire database, including all stored procs, on load). However, it has a command line mode which is probably all we'll ever need. While there is a Visual Studio addin that works with the templating infrastructure (TT) it was found that the simpler approach was to use the POCO tool directly and copy code to VS.
Once installed you can use options as shown in the following figure as starting point.

The equivalent command line would be this if you prefer:

The Binders also make use of some custom Attributes that were added “ChangeTrackingAttribute” which identifies the create/edit user and datetime. The Binder updates all these as appropriate when inserting or updating a record.
To get all the pCreateUser, pEditDateTime, etc. fields correctly attributed, edit your POCO class to derive from ChangeTracked.
Kobo Framework Data Collection
This feature allows custom school inspections to be implemented as Kobo Toolbox forms, and loaded into the Pacific EMIS. In addition, this feature can work with Excel spreadsheets of conforming layout, regardless of whether or not those spreadsheets originated with Kobo forms.
Initial Set Up
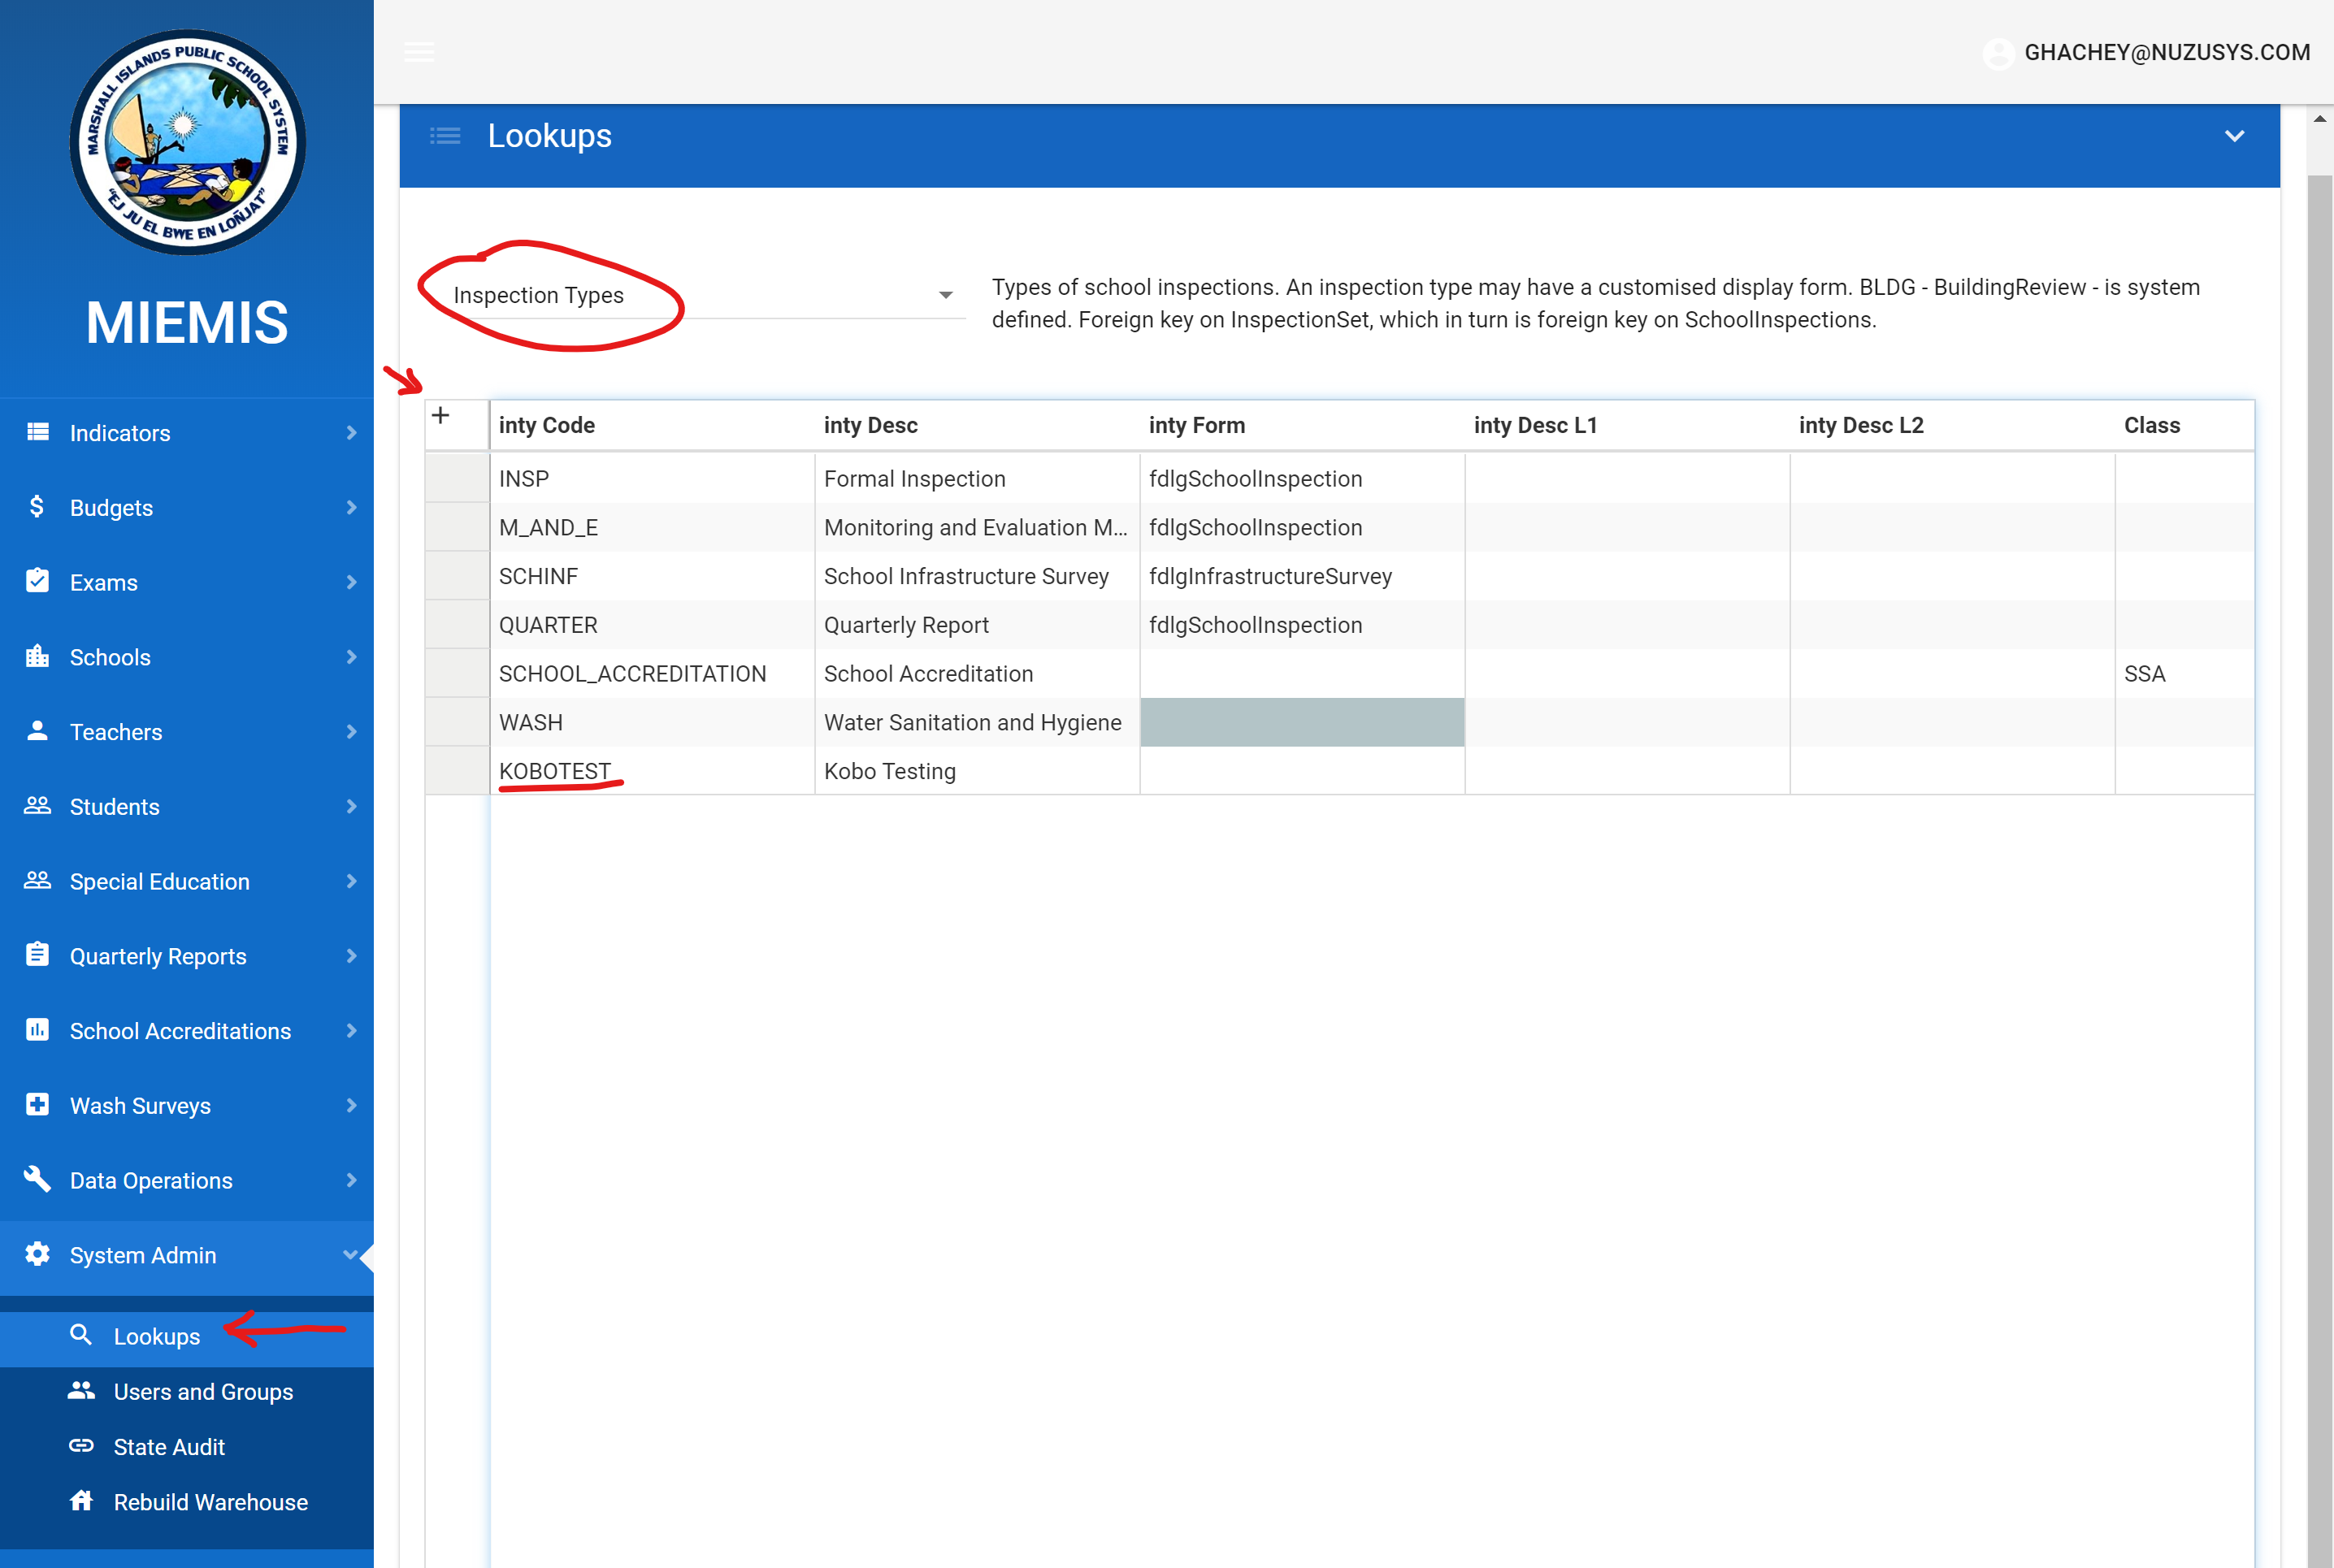
First step is to create a School Inspection Type to represent the custom inspection type (e.g. WASH inspection, Accreditation Inspection, Covid-19 Preparedness Inspection.) This can be done directly in the Pacific EMIS Web UI in System Admin → Lookups as shown below.
Next, design the form in Kobo toolbox. You will need an account with kobotoolbox.org. After going through a little of the documentation you can quickly design you own data entry forms. See the sample below.
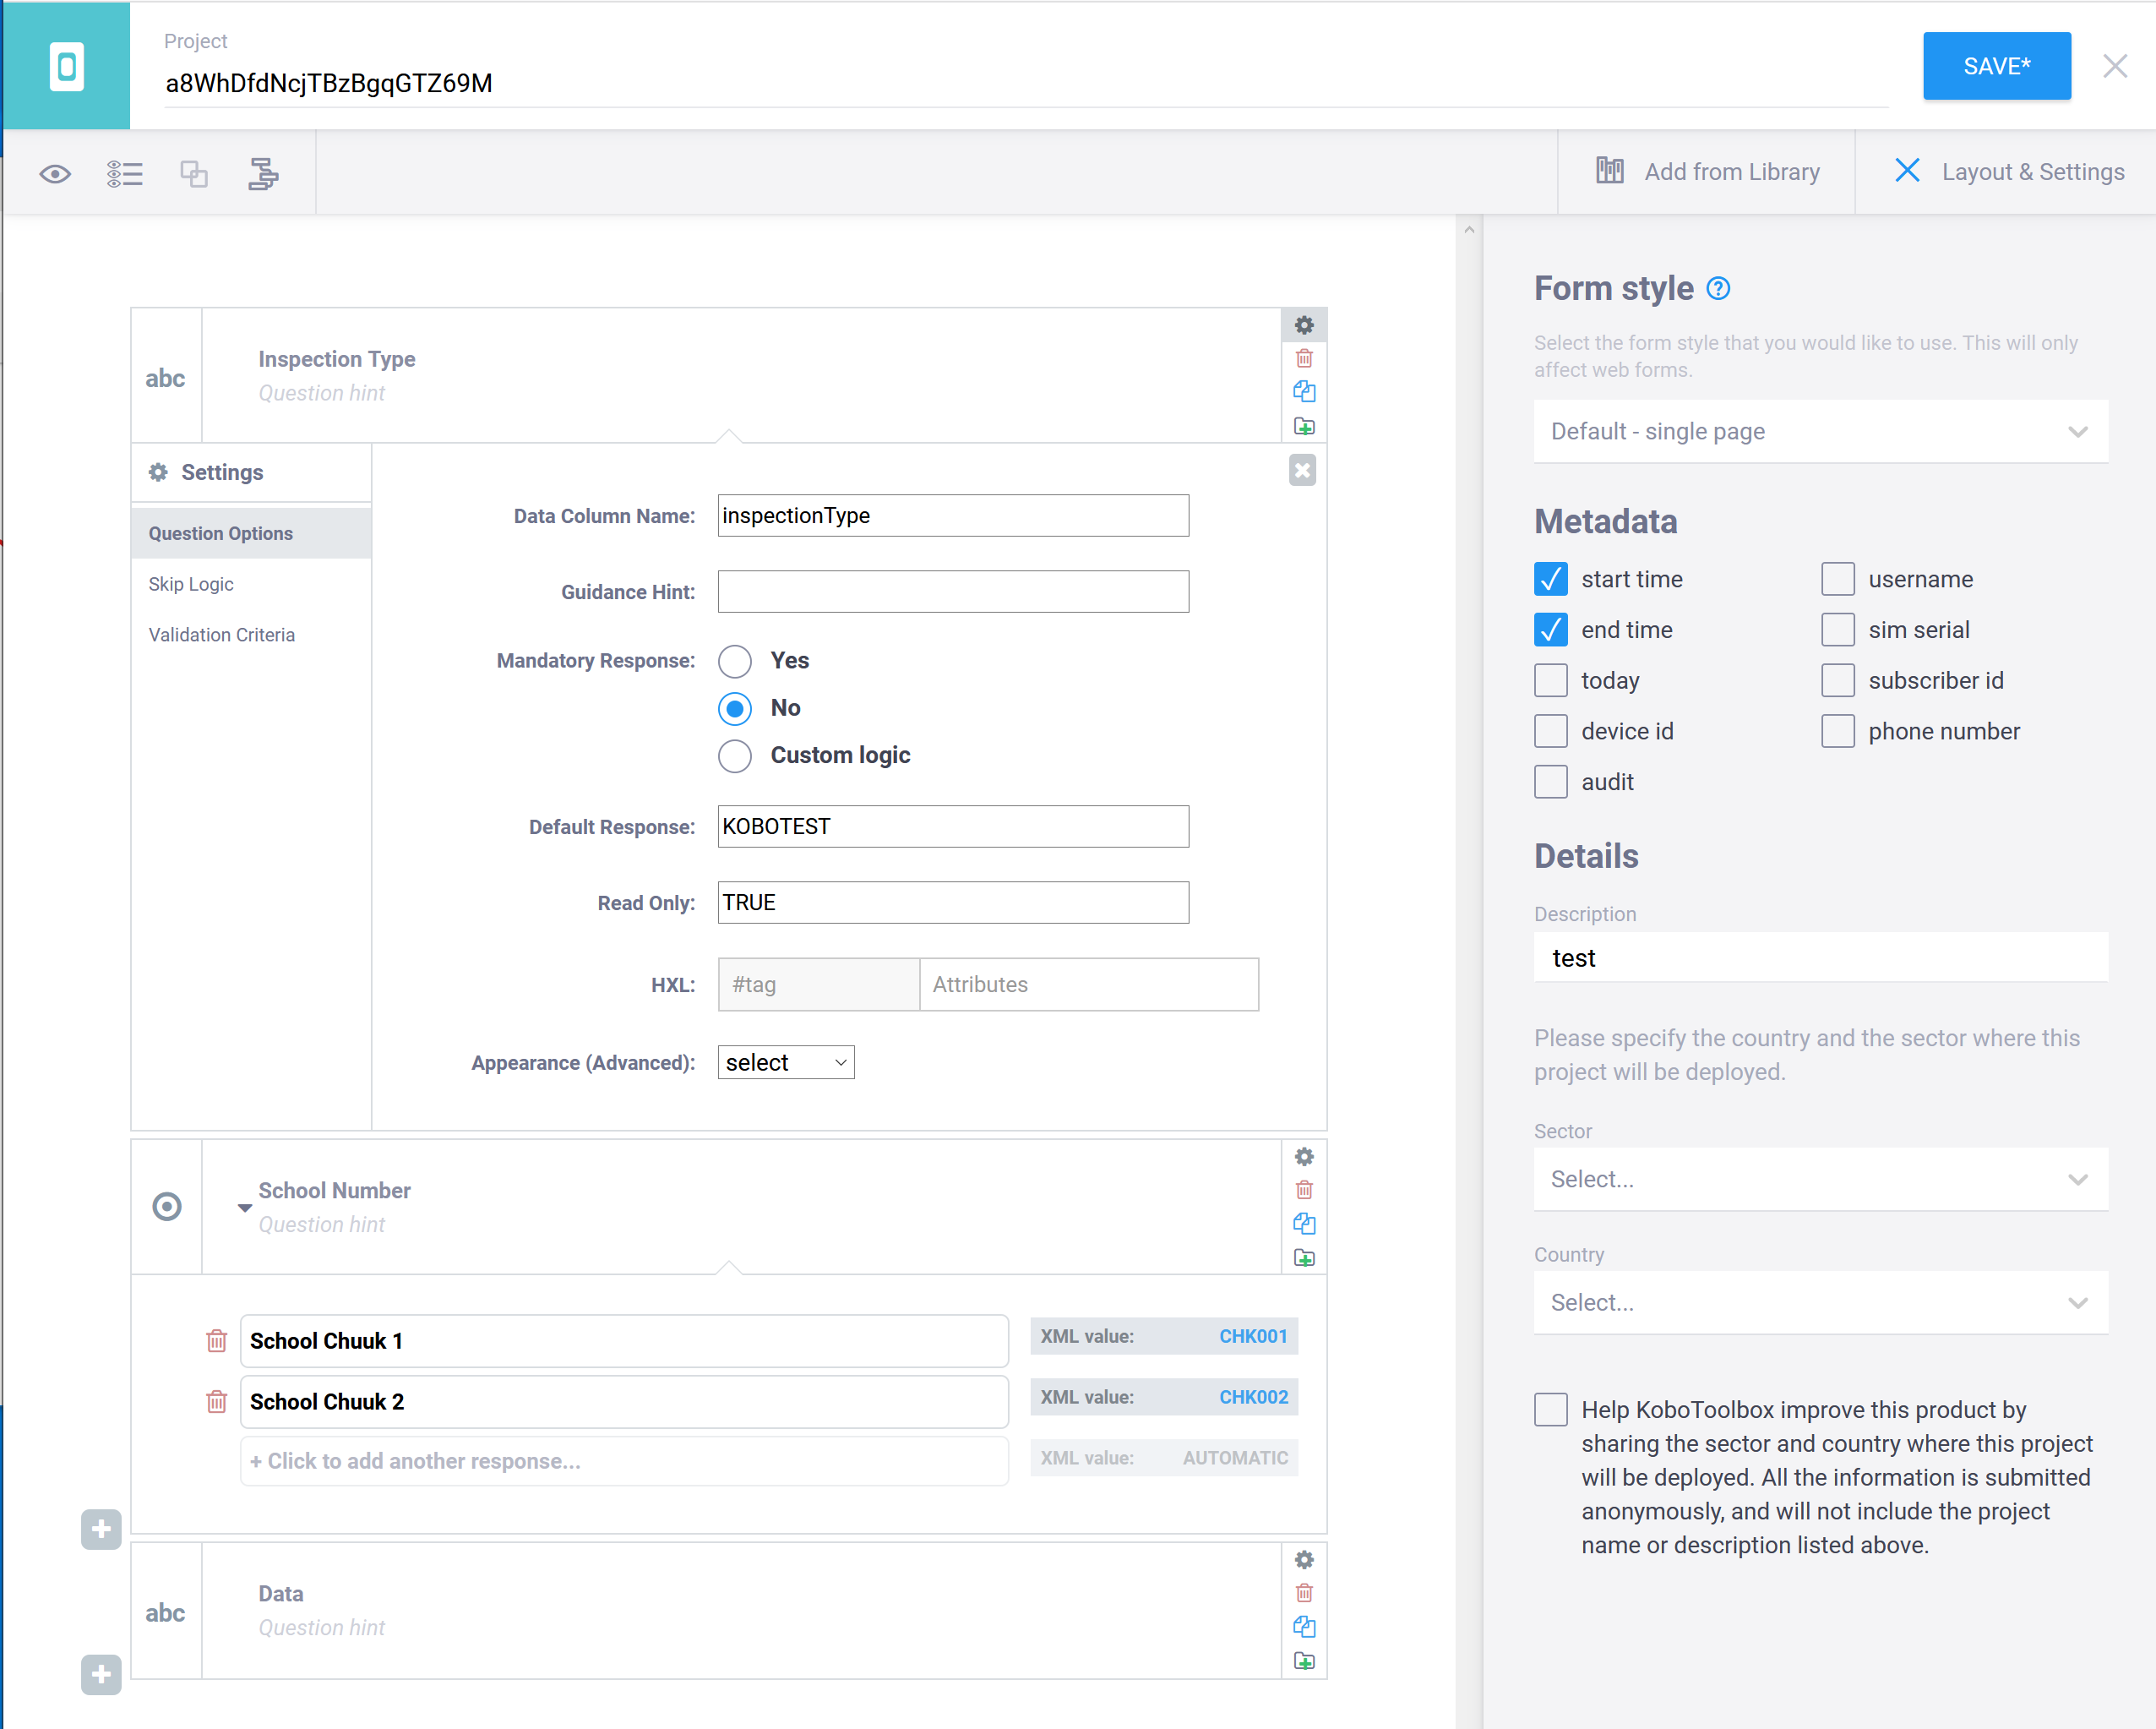
There are just four requirements:
- The form must have a column with Id inspectionType (case-sensitive). This could be a calculated field, and its value should be the new inspection type code set up in the Pacific EMIS first step. Make it read_only to avoid users touching this data field
- The form must have a column schoolNo. It doesn’t matter how this is implemented; for example, as a straight text box, as a dropdown list from existing schools in the Pacific EMIS (preferred method), or even as a calculation of some sort if you are an advanced user. The value in this column is mandatory and must be a valid School No that exists already in the system.
- The form must have columns start and end recording the start and end date/time that the survey took place. These are always included in KoboToolbox forms, but if you are getting the Excel from another source, or creating it by hand, you will need to ensure these fields are present.
- The data columns should have simple, consistent names.
Loading
A form meeting this design can be loaded into the Pacific EMIS using the kobo upload page (i.e. URL /#!/kobo/upload.) First, download the form data from Kobo as an Excel file.
When you load the file into the Pacific EMIS, the uploader writes a new school inspection record of the custom type for each school. The date of the inspection is taken from the Kobo start and end fields. The custom fields in your survey are stored as a single XML “blob” on the inspection record.
Processing/Reporting
To report on the inspection type, create a new view in the Pacific EMIS database with the name pInspectionRead.<inspectiontype> i.e. for inspection type KOBOTEST (as used in the sample kobo form above) this view is pInspectionRead.KOBOTEST. The job of this view is to dig your custom fields out of the school inspection’s XML. This sample shows how:
ALTER VIEW [pInspectionRead].[KOBOTEST]
WITH VIEW_METADATA
AS
SELECT S.*
, S.InspectionContent.value('(/row/@Index)[1]','int') rowIndex
, S.InspectionContent.value('(/row/@Data)[1]','nvarchar(50)') DATA

FROM pInspectionRead.SchoolInspections S
WHERE S.InspTypeCode = 'KOBOTEST'
GO
Here the Data field (and it could be any number of fields on your form) correspond to the custom field names created in the Kobo designer. InspectionContent in this view represents the XML blob; the value function extract the fields by name. The second part of the value function specifies the data type of the extracted value; use int for whole numbers, nvarchar(50) for text, float (or decimal) for numbers that may contain fractions, etc. These same names are used for the resulting columns in the output, as shown here:
This data could be used to source a Jasper report, a pivot table, or other reporting output. Further the stored procedure pinspectionRead.ReadInspection <inspectionID> will return the data for a single inspection – using the appropriate query for the inspection type (if an override exists).
This could be built upon in future development to allow custom user interface by inspection type within Pacific EMIS.
PDF Survey Data Collection
The library pdfFileAnalyzer described in this CodeProject article is the one used. Of particular interest is the followup article by the same author, which specifically addresses getting form fields.
The PdfFileAnalyzer is included via nuget https://www.nuget.org/packages/PdfFileAnalyzer/. From the form field extraction project, one class is extracted as source and further modified. All this is covered by the very liberal CPOL licence. There are other custom classes that deal with the presentation of the form fields in the standard XFDF XML representation. XML in this format is passed into the stored procedures for loading.
Dashboard Framework
General
The dashboard framework is built on the collaboration betwen objects of two types:
- a Dashboard; and its
- DashboardChild objects.
Each DashboardChild provides some rendering (chart, table, map … ) or some data. The Dashboard provides a set of services to these objects.
The Dashboard:
- provides data to the DashboardChild
- manages “filters” ie selections to apply to that data
- is a “broker” for communication between Child objects
- manages the disposition on the page of the Child objects.
There a couple of models of dashboard, based on the type of data that is made available to the children.
- CrossfilterDashboard: the dashboard builds a crossfilter from data that is generally retrieved from a warehouse table. The Dashboard will create useful crossfilter dimensions and all this is accessible to the children.
- PAFDashboard: the dashboard loads PAF data (i.e. VERMPAF.xml), and exposes the API for children to drill into this.
- ModelDashboard: the dashboard loads an instance of a complex object (e.g. school, student, teacher), so children can work with its collections (e.g. surveys, enrolments)
The dashboard functionality is implemented through a combination of:
- code: typescript class that can be extended to form new angularjs components;
- master layouts: implemented via MVC (i.e. razor) master pages used by each dashboard and each dashboard child;
- css: to manage dynamic layouts and animation.
Layout
The dashboard uses masonry.js to layout its children in a grid. The grid is based on units of 150px x 150px. Each child decides what size it wants in these units (e.g. 3×2; 5×4)
This is then specified in css like this :
class="dashboard-wrapper height3 width4"
Selected Child
The dashboard allows the user to 'select' a child on the page, and make that child “lift” and expand to fill the full page width. Children can test whether they are Selected, or Unselected (i.e. some other child is selected) and can respond accordingly. Note that most of the time all components are neither Selected nor Unselected.
Options
The dashboard manages an options class whose properties specify possible filters on the data. These properties are named selectedYear, selectedDistrict, selectedSchoolType etc. When an option is changed, the change is communicated by the dashboard to all children. The child can then adjust its display in response. It may filter its data, simply highlight a bar or slice of a chart or highlight a row in a table.
A child has access to the options object (via this.dashboard.options) and can set its properties directly. For example, this can be in response to clicking a bar in a chart, or clicking a row in a grid. For example:
- the user clicks a bar in a chart
- the click handler in the child component sets the option appropriately
this.dashboard.options.selectedDistrict = <district represented by the bar>
- the dashboard detects the option change, and may action it if required
- the dashboard communicates the option change to all children.
- this fires the onOptionChange event in each child, which executes any reconfiguration
In a CrossfilterDashboard, the dashboard responds to an option change by appropriately applying (or removing) a filter from the relevant dimension. In this circumstance, the child built on the crossfilter has no work to do since the change in filter on the dimension is transparently applied to any crossfilter groups built on that dimension.
Communication
Each child holds a strongly-typed reference to its dashboard. This is implemented via the require option in the component definition class. (see earlier comment). Communication from the dashboard to the children is all handled by bindings, so there is no need for the child to set up any watchers.
The base classes respond to these bindings by firing particular events; so when developing a child component, you need only to derive from the base class, then override the event to respond to the binding change.
Bindings and their events are:
dashboardReady (onDashboardReady)
Signals that the dashboard has prepared data ready for consumption by the children. The child component should implement any setup in onDashboardReady.
The property dashboardReady in the Dashboard is passed to the client. This is just a number. The dashboard should increment this number whenever its data changes. This allows for the possibility of more interactive dashboards (i.e. on change of option, rather than filtering an existing pool of data, the dashboard could respond to the change of option by fetching new data, then incrementing dashboardReady to inform the clients of the change.)
optionChange (onOptionChange)
Receive an 'optionchange' object that has a property for each option changed, and old and new values (i.e. { selectedYear: { new:2017, old: 2016} })
This value is passed to the onOptionChange event, however, the child will most probably work directly with dashboard.options in response to this event.
selectedChild
The selected Child has changed. The child can check if it has become the selected child and can react accordingly. Note that while children get explicit notification of such changes, many responses can be implemented without any action in code. Mechanisms to facilitate this include:
- Crossfilter: as noted, filters applied in the dashboard in response to an optionchange are transprent to the client
- ng-class / css
- a table can make use of utility functions in the base ChildDashboard class, and in the options class, css and the ng-class and ng-show directives to render changes in selected options (e.g.
<tr ng-class=“{'selected', vm.dashboard.options.isSelectedYear(d.year)}”>)
Reporting
The dashboard child may have an associated report in the Jasper report tree. This can be hard-coded in the defaultReportPath property of the child, or else passed in via the binding reportPath (i.e. report-path). Default handling is:
- when a report is set, an icon appears in the child's header.
- Clicking this item runs the report
- the child can implement setReportContext to set up report parameters; this is intended to be used to do any mappings between the current dashboard options and the report parameters.
- As usual , any required parameters that are not supplied will be prompted for at runtime.
Charting Library
Over the years a number of charting library were used each addressing a particular need never able to cater well for all cases. Then came echarts. All old charts are being converted to echarts (and even GIS widgets) and all new charts shall make use of echarts.
Architectural Notes
Some thoughts on architecture and what we need to do to cover off on everything we need. At the lowest level, an echart will contain an instance of the component EChart.Component. This does very little; it does not attempt to draw a chart.
It functions only to:
- instantiate the echart object,
- provide a callback (
onChartInit) so that the containing component can get the echart - manage resizing of the echart (see Resizing Strategy above)
disposeof the echart when the component is destoyed
So, via the callback, the parent of the Echart.Component holds the instance of its underlying echart object. This is where the chart construction takes place. I foresee at this level, a number of powerful and flexible components aimed at different circumstances. Let’s call these Supercharts. Currently we have our first superchart: EchartRowCol, which takes the place of the plottable-based rowColChart.
This is the go-to component for drawing 2-dimensional data; and it can render 8 formats:
- bar
- percentage bar
- stacked bar
- column
- percentage column
- stacked column
- line (not stacked)
- area (stacked)
Planned components include:
- Map superchart
- pies and donuts
Currently, for historic reasons and compatibility with stored procs and the original RowColChart, EchartRowCol expects data in a particular ‘rowcol’ format: each row looks like
{ R: <the row identifier>, C: <column identifier>, Num: value }
In the more recent dashboards that use RowColChart, data starts off in a Crossfilter group; and this crossfilter data is massaged into RowCol format to give to the chart. However, the internal formats that echarts wants for its datasets are different again. There are a couple of formats supported, but probably best for general purposes is:
{
  dimensions: ['School', 'Boys','Girls'] ,   // array of ‘dimensions’; ie field names
  source: [
    ['School A',6,5],
    ['School B', 4, 3]
  ]
}
So we need ways to get different data shapes into this format (i.e. an echarts Dataset), currently we can accept only 'RowCol' data. We need to be able to transform:
- a crossfilter group
- a key value collection derived from Crossfilter.group.all() nested data??
- plottable legacy models built on a data collection and accessor functions - these accessors can be used to generate the echarts Dataset?
- We also need to rationalise various one-off formats used in Dashboards - see e.g. schoolDashboard, and plottableBarChart, PlottableColumnChart .
So my thinking is to build a Transformer class, that will take incoming data, identify what it is, and work it into echarts format. As noted above, this is currently happening in two steps in new dashboard by
group.all() => RowCol data => echarts Dataset
If we can effectively transform crossfilter objects, we can substitute our echarts-based components for our wrappers around dcjs-based components. EchartRowCol can then effectively handle a significant part of our charting needs - especially if it adds pie and donut capability. Otherwise, we have our other supercharts - map, cloropleth etc - to choose from.
Superchart design
The trade-off here is: how much flexibility to build in to a component like RowColChart via bindings?
Taken to extremes, you could end up creating a parallel API to not much advantage.
So my preferred approach is:
- have a relatively concise set of bindings exposed on each superchart (i.e. EchartRowCol) . As well as providing the data (so that a data change can force a redraw via binding architecture) most options will be about construction of the chart.
- expose from the supercharts a callback
onChartRender(optionthat is called passing back the echartsoptionimmediately before this is submitted to echarts (i.e.echarts.setOption(option);Then the consumer of the superchart can do whatever it likes to the chart using the echarts option API.
As an example, the exam charts are now drawn by EchartRowCol, but use the onChartRender callback to do some specific non-standard things: specific colors, order of the series, width of the label area. See example where onChatRender is implemented.
Supercharts will also provide a callback for formatting tooltips and a clickhandler callback. There are many events raised by echarts, not just mouse events, but events related to actions as well. Supercharts may consume these in internally if they need to. But if the consumer of the superchart wants to handle an event in some special way, I think, rather than having an & binding for every possible event on every superchart; its more expedient for the superchart to simply relay onChartInit(echart) to its client, which can then set up its on bindings, in its own scope.
Steps in building an echart
There are a number of steps in the sequence of building an echart:
- Data transformation - as discussed, we need to get an echarts Dataset from whatever input data we are given. Call this end-product the transformed data.
- Data processing - some modifications we may want to make to the visual appearance of the chart may be best (or only) handled by manipulating the data. e.g. sort a bar or column chart from lowest to high values. So there may be a pipeline of data processes required to get the ‘transformed data’ in to the chart-ready data.
- Chart initialisation. A template for the chart options
- Series initialisation. The series are created as required ( possibly determined by bindings)
- Chart customisations. other options determined by bindings may be sequentially applied to the chart.
Note that when reacting to binding changes, where you need to start in this sequence will depend on what bindings have changed. For example, data transformation is only needed if the dataset has changed. Data processing will be required to respond to specific changes (currently flipping, change to a percent based format, sort changes).
I'd like this flow of steps to be clear in the internal construction of echart components. For example, I’m considering a formal “pipeline” of data processes that is defined so that each step in the pipeline consumes a Dataset produced by its precursor, and outputs and Dataset. The final result of this pipeline is the chart-ready data. So:
- above is the output of a Data Transformer as described above (IN: some data OUT: echarts Dataset).
- the is application of the pipeline (IN: transformed Data OUT: chart-ready data)
Troubleshooting Charts
A handy tip for debugging echarts you are creating. First notice that any of the examples at https://echarts.apache.org/examples/en/index.html open an interactive javascript editor. You just need to set the value of a variable called option in this window, and that option will get generated into a chart. Now if you are creating an option object in your typescript, use the chrome debugger to
console.log(option)
to get your option object into the console window. Following this tip: https://superuser.com/questions/777213/copy-json-from-console-log-in-developer-tool-to-clipboard you can get this option object on to the clipboard. Right-click the object and select “Store as global variable”. The console will print the new variable's name, for example:
//temp1
Type the following in the console.
copy(temp1)
The object is now available in your clipboard. Now you can paste that object into the echarts example JS, to set option to this value. Run it to see the result. You can now tweak the option in the debugger to fix any problems, then go back to your typescript code to implement these fixes.
Frontend Framework
TypeScript and Angular is used in the frontend along with various dependencies. This section documents various bits related to this.
Staying up-to-date with TypeScript and Frontend Dependencies
Get the latest from https://marketplace.visualstudio.com/items?itemName=TypeScriptTeam.typescript-341-vs2017 and install.
For best results - pull the latest pineapples build (including the typescript 3.4 upgrade) to your machine with VS closed. Then, when you open VS, it should run the package.json upgrades (installing typescript 3.4 compiler in Pineapples.Client) and the bower upgrades (e.g. the upgrade of lodash 4.x)
Note that in VS2017, this automatic restore is controlled by options
Move from obsolete TSD/Typings to Installing using npm
Note that we now have a first step in this direction as of pull request #304 which installs lodash.d.ts using npm like this:
npm install @types/lodash
and references it using the tsconfig.json types compilerOption
  "compilerOptions": {
    "target": "es5",
    "noImplicitAny": false,
    "sourceMap": true,
    "sourceRoot": "../../../Pineapples.Client/src",
    "removeComments": false,
    "allowJs": true,
    "outFile": "../dist/scripts/app/pineapples.js",
    "types": [
        "lodash"
    ]
We can start to migrate others as required. Note we have to be careful where some .d.ts files have been edited by hand.
Remoting and library location
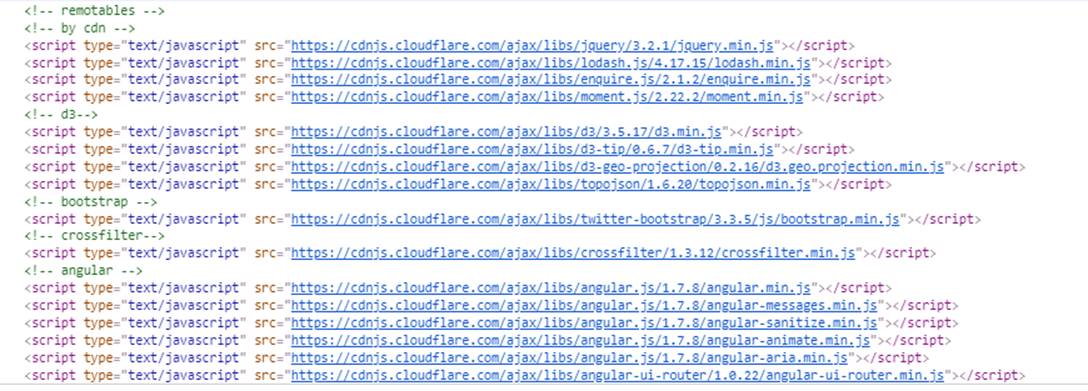
In Pacific EMIS you can specify “remote” sites either by inclusion (specifying “remoteIp” range) or by exclusion (specifying localIp range). When you are operating remotely, some of the large and commonly used javascript libraries are sourced from cloudflare cdn, rather than from the Pacific EMIS server itself.
To tell what is going on you can “View Source” or Inspect in Chrome, to examine the styles and script tags:
Within “local mode”, there are two options depdning on the setting of the debug option in web.config.
When debugging is off:

Then ASP.NET bundling and minification kicks in: the javascript and css are crushed down into 3 minified files:
- App – the ones we wrote
- Vendor – 3rd party stuff that cannot be sourced from a cdn
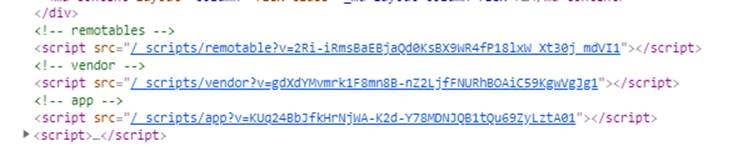
- Remotables – 3rd party stuff that could be sourced fron a cdn
So you see this in the base page:
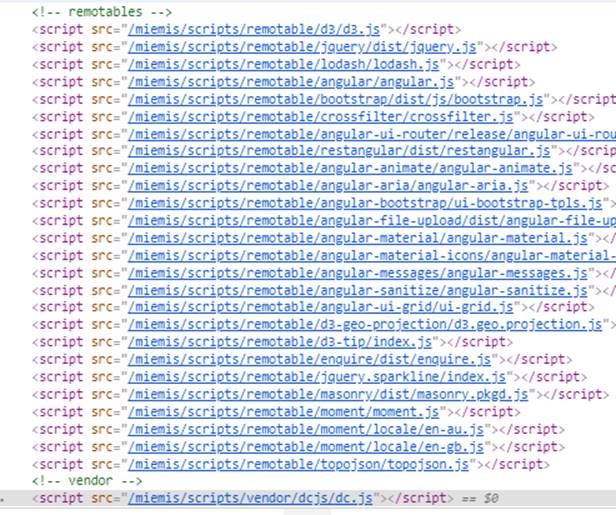
If debug is true, then there is no bundling and each files is delivered separately:
If remoting is on; then this section of the page looks like this:
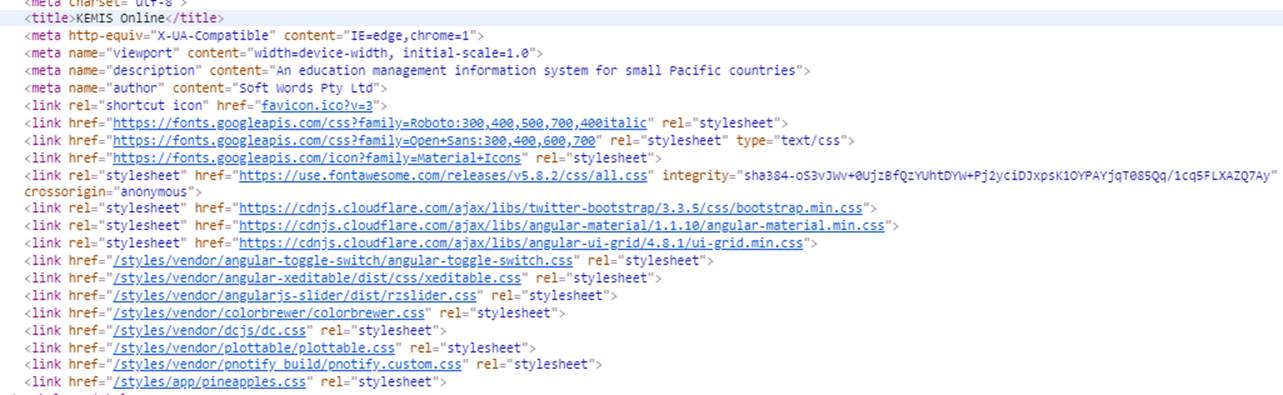
The Css section looks like this: in remote mode, those Css that can get remoted are remoted:
Low Level Documentation and API
The lower level documentation about software design, application programming interfaces, small gotchas and all other nitty-gritty details about the source code is written directly inside the source code. It would be nice to eventually be able to extract and export to hard copy formats such as HTML or PDF using a tool like Doxygen. Currently the place to access it is directly inside the source code as this documentation process is just started off.
Since many things are yet undocumented here are a few things to keep in mind.
- there's no comprehensive documentation of the private Web API. In the code, look in the API files on the client, and the WebApiConfig.cs class in App_Start in Pineapples, which is where most routes are defined. Again, Fiddler gives you a look at what is being fired off to the server as you perform each operation.
- JSON is the data format used by the Web API (except for the AtAGlance call, see next point). Parameters passed up to the server are converted into objects or variables sent to the method in the WebApi controller. This happens automatically, but there is ways to dig in to the metadata to control how this happens. Similarly, objects returned from the Controller get a default conversion to JSON to send back on the response; you can control what this JSON looks like if you need to. In many cases, what we send back is a “DataResult” object which is one or more named DataTables, together with metadata defining the Page read, page size, the total number of records, first / last record. Using Fiddler, you'll see both the request sent up and the response sent back.
- The AtAGlance pages are built from a static XML file containing a table of aggregated values. Particular values are dug out of this XML using Jquery as a kind of client-side “xpath”. Some bulk operations in Pineapples pass blocks of XML representing a collection of records into the Sql Server. The Enrolment edit page does this. So the JSON returned from the client is transformed to XML then passed to the SQL server.
Notes Teacher Data Processing
Collection
- Census workbook (Excel XLSX)
- PDF survey
In both cases the data are reduced to XML; however the formats are different.
Upload
The Excel and PDF documents are uploaded and processed to extract the XML contents, which are uploaded into the EMIS database.
Main tables
- TeacherIdentity: records represent a teacher
- TeacherSurvey: the data collected about each teacher in the annual survey. TeacherSurvey holds the source XML data for each teacher. The formats differ depending on the source (PDF / XLSX). TeacherSurvey is the main operational table of teacher data.
- Also use pTeacherRead.TeacherSurveyV which provides denormalised values (school, surveyYear).
Accessing TeacherSurvey XML
The functions pTeacherRead.Activities and pTeacherRead.TeacherQualCert shred the source XML on TeacherSurvey into relational records.
Main functions
- Handles both formats (PDF/XLSX) of source XML to produce a common rowset — consumers downstream of these functions deal with a consistent data format regardless of collection source.
- Shows the array of Activities — all classes taught, A = Admin and X = Other.
- Calculates the “Allocated Class Level” (the most representative single class level for each teacher).
- From AllocatedClassLevel, derives Allocated Sector, EdLevel and ISCED.
- Uses AllocatedSector and qualification history to determine Qualified and Certified status for each year.
pTeacherRead.TeacherQualCert has three principal uses:
- Provides detailed teacher data to the School page (available without a warehouse rebuild).
- Provides the History tab on the Teacher page (no warehouse rebuild required).
- Used by the warehouse rebuild; Qualified and Certified status are consolidated in one place.
Warehouse Teacher Info
The fundamental warehouse table for teacher data is warehouse.TeacherLocation. This performs several functions:
- For legacy reasons, can incorporate teacher locations sourced from Appointments.
- Collects all survey data, Qual/Cert status and allocated Level, Sector and EdLevel from
pTeacherRead.TeacherQualCert:
- Supplies Estimate records for missing surveys.
- Includes teaching staff and non‑teaching staff (A, X).
Common filters on TeacherLocation
TAMX in ('T','M') — filters to staff performing some teaching duty. M staff also perform Admin or X Other duties. Source not in ('A','A?') — remove any record sourced from Appointment and not supported by survey. Note that TAMX in ('T','M') excludes these records as well.
Use the Source filter to get all survey teacher info, including Estimates and Admin/Other staff.
Grouping by AllocatedEdLevel, AllocatedSector, AllocatedSCED one can then COUNT(*) or SUM(Qualified), SUM(Certified).
Note: Aggregates on warehouse.TeacherLocation vs pTeacherRead.TeacherQualCert differ because TeacherLocation provides the Estimate records. These queries return the same record count:
SELECT * FROM pTeacherRead.TeacherQualCert(NULL,NULL,NULL,2024, NULL,0)
SELECT * FROM warehouse.TeacherLocation WHERE SOURCE NOT IN ('A','A?') AND Estimate = 0
All teacher reporting from the warehouse should ultimately draw from warehouse.TeacherLocation so that interpretations of Allocated and Qualified/Certified match those embodied in pTeacherRead.TeacherQualCert.
Examples
SELECT * FROM warehouse.TeacherLocation WHERE SOURCE NOT IN ('A','A?') — ALL staff derived FROM surveys (including Estimates FROM previous surveys).
SELECT * FROM warehouse.TeacherLocation WHERE TAMX IN ('T','M') — ALL staff WITH at least one teaching activity.
SELECT * FROM warehouse.TeacherLocation WHERE TAMX = 'A' — ALL staff exclusively admin workers.
SELECT * FROM warehouse.TeacherLocation WHERE A = 1 — staff doing SOME admin duties, NOT necessarily exclusively (i.e., may be teaching AS well).
There is one record per teacher per year in TeacherLocation (i.e., tID/surveyYear is unique). Use TeacherLocation for lists of teachers as well as aggregates.
warehouse.TeacherLocation includes Gender and Age Group; for other demographics, including name, join back to TeacherIdentity.
Weightings
A major group of tables derived from warehouse.TeacherLocation are:
- warehouse.TeacherActivityWeights
- warehouse.TeacherActivityWeightsEdLevel
- warehouse.TeacherActivityWeightsSector
- warehouse.TeacherActivityWeightsClassLevel
To handle the fact that a teacher may perform multiple activities, weightings are applied to teacher activities in the aggregation category to avoid double‑counting when aggregating.
Example (UIS A9 sheet): we record the number of teachers teaching in ISCED 1 and the number teaching in ISCED 2, then add totals across the page. If a teacher teaches one class at ISCED 1 and another at ISCED 2, counting them as 1 in each would inflate the page total.
To overcome this, we weight a teacher's activities as a fraction of all their teaching activities. If Teacher A has 2 activities (1 in ISCED 1 and 1 in ISCED 2), their weighting for ISCED 1 is 0.5 and for ISCED 2 is 0.5, so their contribution to the page total is 1.
Terminology
FTPT (Full Time / Part Time) weighting — teaching activities in some group (ISCED, EdLevel, Sector, Class Level) as a fraction of the total teaching activities of that teacher. FTE (Full Time Equivalent) — teaching activities in some group as a fraction of the TOTAL activities of that teacher (including any A or X activity). Example:
Teacher B teaches 1 class at ISCED 1 and is recorded as performing Admin tasks. FTPT for ISCED 1 = 1 (1/1 teaching activity). FTE = 0.5 (1 divided by 2 total activities). Difference between FTPT and FTE depends on whether the teacher performs A or X activities. Aggregated, the difference indicates teacher time spent on admin tasks.
Filter by TAMX in ('T','M') to consider only teacher activities, consistent with UIS Survey page A9.
A third weighting mechanism is Allocation: allocate a teacher to a single AllocatedClassLevel, and from this to a single AllocatedISCED, AllocatedEDLevel, AllocatedSector. This allocation is produced in pTeacherRead.Activities and is used in the weighting tables.
Example:
Teacher C teaches 3 classes at ISCED 1 and 1 at ISCED 2. AllocatedISCED = ISCED 1 (most activity). FTPT for ISCED 1 = 0.75, for ISCED 2 = 0.25. Using Allocation: Allocated ISCED 1 = 1, Allocated ISCED 2 = 0. Page total remains 1. TeacherActivityWeights entries for Teacher C:
ISCED 1A — W (FTE): 0.75, WTeach (FTPT): 0.75, Allocated: 1 ISCED 2A — W: 0.25, WTeach: 0.25, Allocated: 0 Summary: a teacher will have entries in this table (for a given year) for each ISCED Level in which they teach; exactly one of these records will have Allocated = 1.
Head Count (unweighted totals)
Head Count = number of teachers who do any activity in that group regardless of other activities. One teacher may be included in multiple categories; head counts cannot be summed without double counting. To get Head Count by EdLevel:
SELECT surveyYear, EdLevelCode, COUNT(tID) HeadCount
FROM warehouse.TeacherActivityWeightsEdLevel
WHERE TAMX IN ('T','M')
GROUP BY surveyYear, EdLevelCode
To get a Head Count grand total (without double-counting):
SELECT surveyYear, COUNT(DISTINCT tID) HeadCount
FROM warehouse.TeacherActivityWeightsEdLevel
WHERE TAMX IN ('T','M')
GROUP BY surveyYear
</sql>

=== Handling Admin AND Other (A / X) teachers ===

A/X staff have no teaching class level activities; their allocated Class Level (AND hence Allocated ISCED, ED Level, Sector) IS derived entirely FROM the DEFAULT level OF the school TYPE.
A/X activities are written TO separate ROWS, IDENTIFIED BY the flag AX: NULL FOR teaching activities, OR 'A' OR 'X'.
TO split these off FROM teaching activities WHEN aggregating:

<code sql>
SELECT surveyYear, COALESCE(AX, EdLevelCode) EdLevelCode, COUNT(tID) HeadCount
FROM warehouse.TeacherActivityWeightsEdLevel
GROUP BY surveyYear, COALESCE(AX, EdLevelCode)
Contributions of staff with TAMX in ('A','X'), as well as A/X activities for teachers with TAMX = 'M', are now grouped separately.
VERMPAF
Values from the Weights tables are incorporated into the VERMPAF Teachers node. These are filtered on TAMX in ('T','M') and are consistent with aggregates on the Weights tables when those filters are applied. This filter also makes these totals (for FTE and FTPT) compatible with the UIS Survey.
A Note on the use of Lodash's Memoize Function in Dashboard Components
Beyond this, there is just one pattern that you will see everywhere for which the reason may not be apparent - the use of memoize in the dashboards. While there is some benefit in avoiding calculating the same thing over and over again, this is being used due to how equality of objects in javascript works, and how this impacts the angularjs digest cycle.
In the angularjs digest cycle all of a component's parameters are essentially polled, to see if they have changed - this is how angularjs components know if they need to rerender or not. If a parameter(binding) has changed, rerender. However if a binding is to the output of a function that returns an object, even if it returns an object that contains the all the same values, it's a different object - and the equality test fails. This causes the component to rerender, and as this will happen every digest cycle, hit a safety mechanism whereby if a value changes in 10 successive digest cycles, angularjs throws an exception and stops.
Luckily, simply memoizing the function will solve this, with potentially some saved calculation cycles as well.
However it's necessary to understand the limitations of lodash's memoize function - By default, the first argument provided to the memoized function is coerced to a string and used as the cache key. - It was often necessary to pass a resolver to calculate an alternative key as the second argument to memoize. Also there were times it was necessary to pass an extra argument (not passed to the function being memoized) to use as the key.
Security Considerations
Security is an increasingly important aspect of any project and the Pacific EMIS is no exception. This section describes the security framework of the project.
Authentication
Currently in progress: User Roles Implementation
ASP.NET Identity includes a concept of “Roles”, which are in effect a specific type of “claim” in the claim-based security model. For users authenticated by Identity (ie those defined AspNetUsers in IdentitiesP) these roles are defined in the IdentitesP database. For users authenticated against the domain the Roles collected are theDomain groups that the user belongs to. Being Claims, the Roles are embedded into the Bearer token–so that, every request made to the server has access to the Role membership of the user.
Web Api lets you decorate methods with a Role attribute to determine which role(s) can access that method so you can implement server side security this way. On the client, we send the Role memberships to the client with the Bearer Token, so they are accessible in the client-side code. This is the package that comes down in response to api/token.
In particular, the module *angular-permission* gives a simple way to tie an authorization condition to a state in ui-router so you cannot navigate to that state if the condition is not met. So the intention is to set up conditions matched to Role membership, and assign these on the states on the client, just as we do to the corresponding functions on the server.
So I think we can use these structures to give us quite fine-grained control over authorization for various functions. What we need are:
- abstract definitions of rights represented as Roles (e.g. can save a school, can read teacher info) and
- a mechanism to map into such Roles from domain groups
Other Notes.
- The ASP.NET Identity code was modified to support logins using an ASP.NET Identity user (i.e. defined in the identities database) or a domain login account – so your simplest way to get in will be to supply the user name and password you use to log in to Windows on your machine.
Authorization
The Pacific EMIS uses a granular permissions architecture that divides the application into topics, and assigns rights to the user in that topic, example:
- school;
- teacher;
- establishment;
- enrolment;
- survey;
- finance;
- infrastructure; etc.
Rights are:
- Read : may read topic data
- ReadX: may read extended topic data
- Write: may write basic topic data
- WriteX: may write extended topic data
- Admin: may administer data in this topic; for example manage lookup lists
- Ops: may perform any specific data manipulation operations in this topic.
Some rights imply others (e.g. ReadX ⇒ Read, WriteX ⇒ ReadX, WriteX ⇒ Write)
In the Pineapples database each Topic/Role is represented as a Role (e.g. pEstablishmentRead). These roles are called Functional Roles. The user (logged in to the database using Windows Authentication) belongs to a role representing their user group (e.g. FinanceOffice) and these roles are called Organisational Roles. Each Organisational Roles is a member of a set of Functional Roles. These membership bestow database permissions on the logged in user.
However, the database connection from the web site is made in the name of the service account running the web site, so this model cannot work. Using impersonation limits scalability because database connections cannot be reused. So we need to enforce the user privileges in other ways.
At the server the user must be prevented from connecting to any API endpoint to which they do not have permission (e.g. cannot edit a school record if not assigned to pSchoolWrite.) On the client, the user interface should reflect operations that the user is not permitted to perform (e.g. the edit button in the School Item form is only available if the user is in pSchoolWrite) .
Note that client side permission are treated as a “courtesy”, to allow the user to understand their role, and not perform operations that will fail due to authorization restrcitions at the server, but all authorization is enforced on the server.
More on Permissions
- cleanup with all content above.
Pacific EMIS Online determines the permissions you have from your AD group memberships. It finds all your AD group memberships in AspNetUsers, and finds any Permission associated to that in AspNetUserClaims.

The permission you see here encapsulates the permissions you get shown shown in the Profile (click on your user name). Each character in the Permission hash represents one topic in the list below. The value of that character is the particular permission(s) you have.
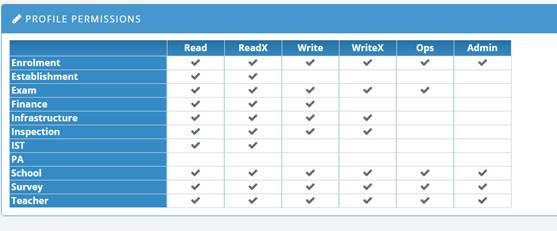
If you compare these 2 screen prints, you’ll observe that:
- o = all permissions
- 0 (zero) = no permission
- 3 = read + readx
- ? = read + readx + write + writex
- etc.
In fact, this is not as strange as it may appear: treat the permissions as a byte-map: Read = 1 ReadX = 2…Admin = 32. Then add them up (e.g. read + readx + write + writeX = 15.) Add 48 to this (= 63). Convert to an asci character = “?”.
However, these permissions are AGGREGATED, that is Pacific EMIS combines the permissions form each AD group you belong to.
Implementing Authorization as Claims
These granular permissions will be determined at login time, and encoded as claims in the bearer token. When an API endpoint is called, authorization is determined by interrogating the claims in the current ClaimsIdentity. Further, the permissions information is sent to the client at login time, along with the token. This enables the client-side code to access this information when configuring the UI.
To keep the data small, the permissions will be hashed into a short string. Each character of the string will represent a topic. Since their are 6 possible rights for each topic, there are 64 possible values for the topic 0–63. Note that the dependencies between rights mean that in actuality, many of these combinations cannot be used. Adding 48 to this value produces a displayable character in the range 48–111. This is the character included in the string to represent that topic. In this way, the permission grid is rendered as an 11 character string.
Server-side Implementation
An attribute PineapplesPermission(topic, right) may be assigned to any API endpoint (i.e. API controller method) to enforce that permission on the endpoint.)
Client-side Implementation
Is based on angular-permission , creating a permission named p<topic><right>, for example:
<span permission permission-only="pSchoolWrite">Click to edit...</span>
Assigning Permissions
For AspIdentity authentications, permissions will be assigned directy into AspUserClaims table. The hashed string will be stored as the claim value.
For AD authentications, we will map the user to a “proxy” in AspNetUsers in identity. This proxy will be determined by the group memberships of the user. The permission claim will be associated to this proxy. For example, a user that is a member of AD group ScholarAdmins may be assigned to a proxy AspNetUser account of the same name. The account will have a permission claim corresponding to the rights assigned to this group.
Menu Control with Authorization
When you log in using an AD account SIEMIS finds all the Active Directory groups you belong to. It looks in AspNetUsers to see if there is an entry for that AD group. If there is, it gets the MenuKey for that group – this is an entry in Navigation table. Now you may belong to multiple groups of course, and these may have different menus. It picks the one with the highest value (i.e. alphabetically first value) in the field MenuPriority on Navigation. For example, if you are a member of grpMEHRD_PCRU, it finds the 2 menus PCRU and ALL – PCRU has higher priority so that what it uses, and you get the ‘Admin’ item on the bottom. This menu is set up when you log in.
There are three types of entry in the Navigation table: menu IDs, headings, and actions. The menu IDs are items that define entire menus. These value are assigned to users and groups in the MenuKey field in AspNetUsers table.
see ALL and PCRU records from figure below.
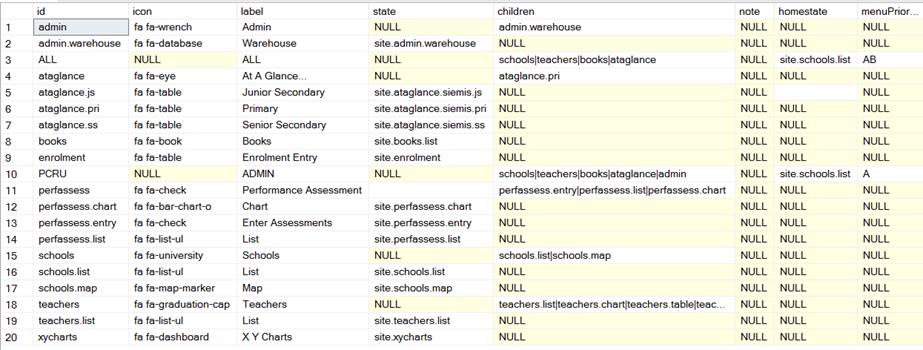
For these items: you define
- Children – this is a set of other entries in this table, separated by |
- Homestate – the page to go to when you first log in. (this is a “state” in the Angularjs client-side code)
- MenuPriority – priority for the menu, to choose between multiple menus that a user may have.
Headers represent headings and subheadings in the menu tree. They define:
- Icon – fontawesome classes for the icon to display beside this menu item
- Label – label to display in the menu
- Children – list of submenus or actions under this heading
Finally there are actions; these define a function to invoke the application:
- Icon – fontawesome classes for the icon to display beside this menu item
- Label – label to display in the menu
- State – the angularjs state to go to when this item is selected.
This is the menu PCRU in action:
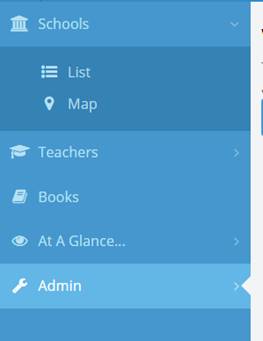
If you follow the chain down from the PCRU menu, through its children and their children, you’ll see how this menu is put together.
Technically, this tree is traversed and turned back into a hierarchy by the procedure getNavigationXml, which produces this:
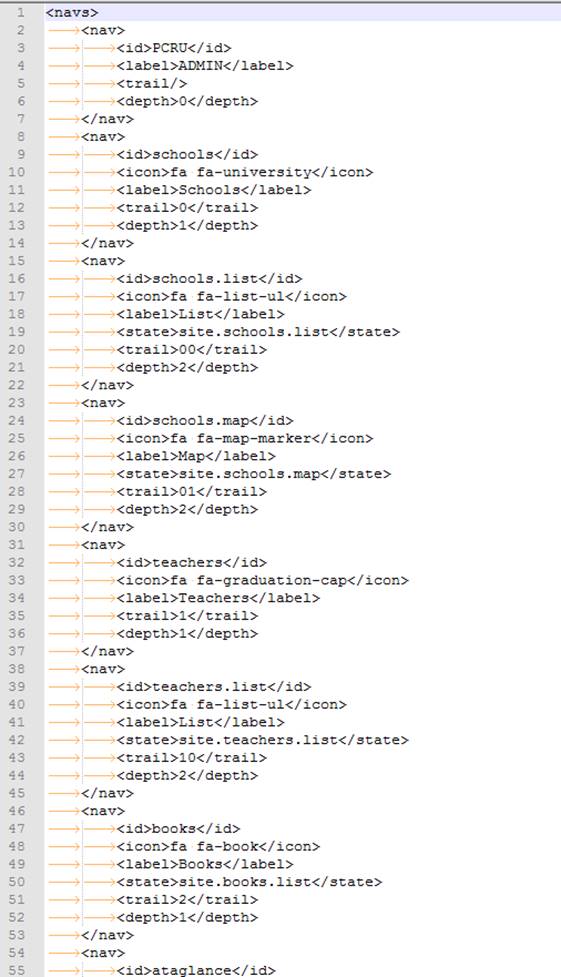
SSL/TLS Encryption
The application support encrypted communication (i.e. HTTPS). In development the embedded web servers already serves pages through HTTPS. In production it would have to be configured to be served on HTTPS with redirect from HTTP to HTTPS to encsure this. Details to achieve this will be documented in the Systems Administrator Guide.
Latest Top 10 Security Risks
The project should always be measured against OWASP's most up-to-date Top 10 Security Risks. It is important to re-assess the project towards this top 10 list on a regular basic (e.g. every year or whenever a new release comes out). Any change should be carefully examine to make sure the application still covers all of them with details reflected in this documentation.
Integrated Penetration Testing
The above guidelines and procedures should offer an excellent starting point to ensure a secure web application. Of course, securing a web application should not stop here. We would like to see a more integrated penetration testing process. There are a number of tools that can be used to help support this process. Most of those tools have a relatelively steep learning curve but they are worth the time investment.
After some time evaluating several free software tools that were either recommended by OWASP or considered promising projects we have come up with a short list of tools to watch:
- Vega a fork of Google Researchers' Skipfish backed up by commercial support. A younger but promising project which seem easier to use at first glance.
One or more of those tools could eventually be integrated into the development process. At first only making use of simple features such as automated scans and slowly integrating more complicated robust testing processes one by one. As these new processes come to live they should be clearly documented here with instructions on how to use the tools.
Project Documentation
Higher level documentation (i.e. User Manual, Systems Administrator Manual and this Developer Manual) is prepared using the collaborative tool Dokuwiki. To contribute you simply need to create an account and have a project manager assign you the rights to edit.
Functions and Data
A whole lots of things useful to know when developing on this Pacific EMIS. What will be documented here will be similar to low level documentation but not quite that. Like miscellaneous low level stuff [argh! cringing on my own words].
Data Warehouse
The database has numerous tables, view, procedures, etc. It would be daunting to get good data out of a highly normalised schema. For this we have the data warehouse layer. The data is exposed to developers, data managers and end-users in a more accessible format through this data warehouse layer. All tables and views with the schema warehouse (i.e. starting with warehouse.*) form this data warehouse layer.

They should always be used when possible instead of building large queries from scratch to access data. This will ensure a consistent view of the data across various presentation layers (e.g. power point presentations, Jasper reports, online dashboards, website, etc.) and also eventually when the data collection processes are improved and stable a consistent view of the data over time.
Survey Year Filter
Implemented through a new angular filter, surveyYear. This relies on a sysParam, SURVEY_YEAR_FORMAT which is a template for the format. The template may contain these tokens:
* yyyy : 4 digit survey year * yy : 2 digit survey year * nnnn : 4 digit next year * nn : 2 digit next year
e.g. token SYyyyy-nn for value 2015 produces SY2015-16
This is incorporated into default school SurveyList.cshtml to get started but everywhere a school year is used this filter should be used to display the full school year.
For reporting it may be useful to get this conversion done in the server, in the recordset presented to the report. For this you can use the Sql UDF common.surveyYearFormat like this.
SELECT common.surveyYearFormat(svyYear) surveyYear
FROM SchoolSurvey